Join Our Telegram channel to stay up to date on breaking news coverage
ETH Price Prediction – March 10
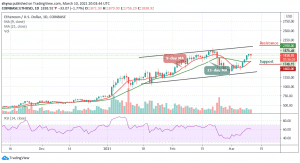
The Ethereum price is currently retreating as the coin journey towards the $1700 resistance level halted.
ETH/USD Market
Key Levels:
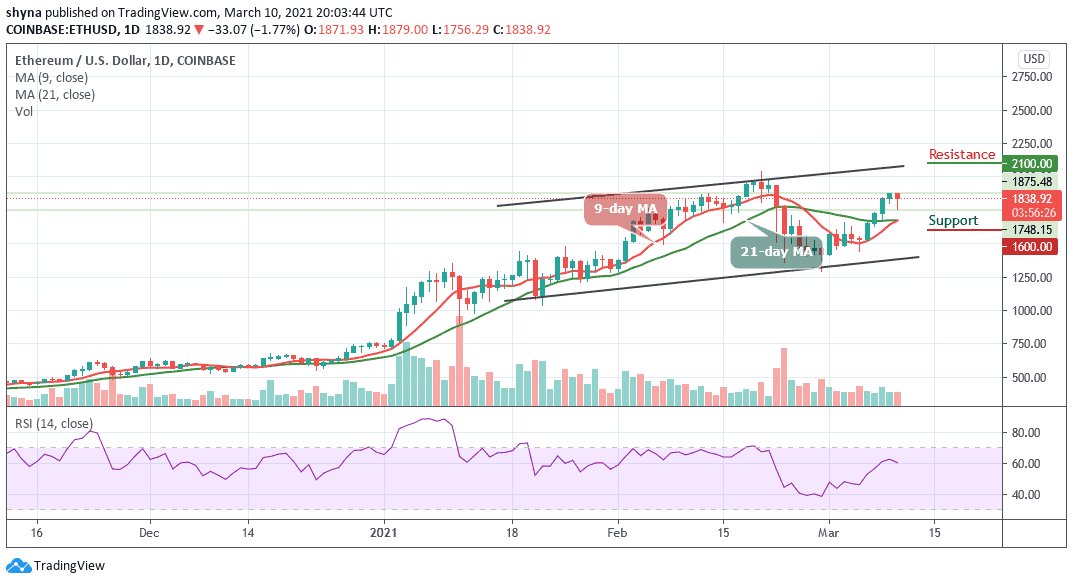
Resistance levels: $2100, $2200, $2300
Support levels: $1600, $1500, $1400
ETH/USD couldn’t climb much higher from the $1872 level as the market begins to roll over and fall within the channel. This decrease is largely attributed to the fact that ETH/USD plummeted pretty significantly. The price of Ethereum remains above the 9-day and 21-day moving averages and if ETH/USD continues to fall and drop beneath the support at $1700, the coin may turn bearish.
What to Expect from Ethereum (ETH)
If the sellers push the Ethereum below the moving averages, the next support levels may be located at $1700. This is followed by significant support towards the lower boundary of the channel and a downside may come into focus. Therefore, if the $1650 breaks, further support may be located at $1600, $1500, and 1400 levels.
Meanwhile, the RSI (14) is moving beneath the 60-level, if it continues to fall, the increased bearish pressure could drive the Ethereum price towards the lower boundary of the channel. However, the signal line may drop more and looks primed for another bearish crossover signal. The resistance levels are located at $2100, $2200, and $2300.
When compares with Bitcoin, the Ethereum price is range-bound as the coin trades around the 9-day and 21-day moving averages. More so, the sellers are likely to pose an additional threat which may cause the buyers to reach the support level of 0.028 BTC should it cross below the lower channel. However, an eventual break below the channel may cause Ethereum to hit the support levels of 0.025 BTC and below.
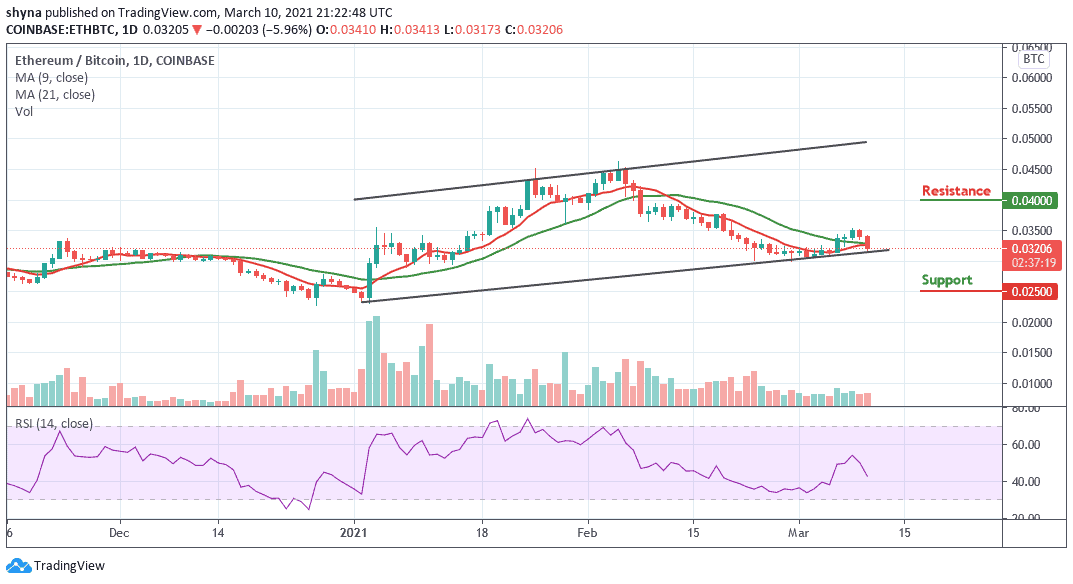
Moreover, the daily chart reveals that the buyers may come to focus if the price moves above the moving averages to reach the potential resistance at 0.040 BTC and above. On the contrary, the technical indicator RSI (14) is moving to cross below the 40-level, indicating that more bearish signals are coming up.
Join Our Telegram channel to stay up to date on breaking news coverage