Join Our Telegram channel to stay up to date on breaking news coverage
ETH Price Prediction – February 27
According to the daily chart, Ethereum (ETH) is gaining ground after touching the low of $1400.
ETH/USD Market
Key Levels:
Resistance levels: $1750, $1850, $1950
Support levels: $1200, $1100, $1000
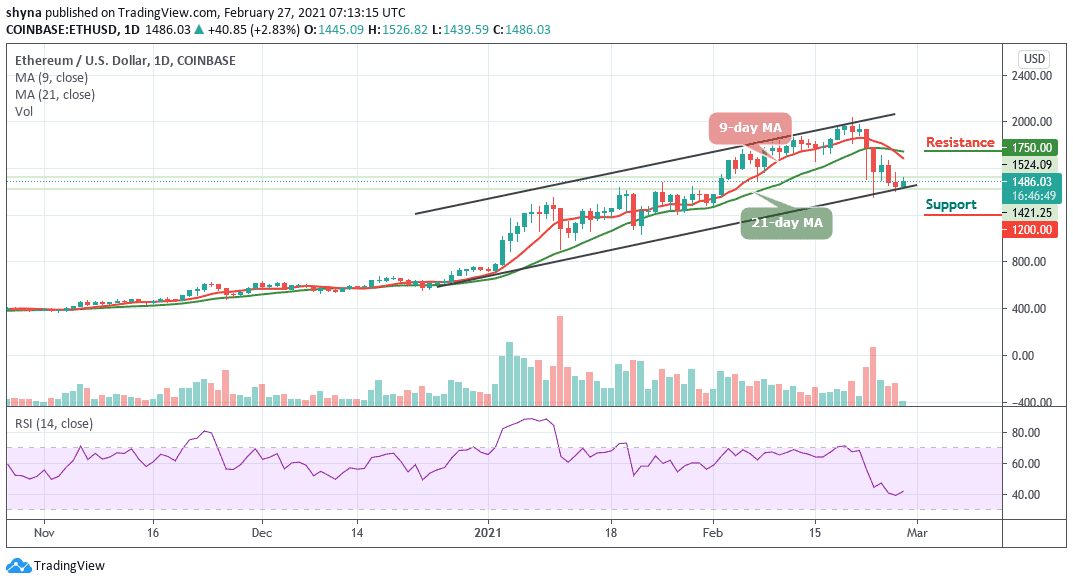
ETH/USD hits the recent low of $1400 and now recovering slightly above the $1450 but at the time of writing, the second-largest digital asset is trading at $1486.03 level with a gain of 2.83% both on a day-to-day basis, moving within the short-term bullish trend with low volatility below the 9-day and 21-day moving averages.
Where is ETH Price Going Next?
On the intraday chart, ETH/USD is trading near the lower boundary of the channel at $1445. If the bulls break above the $1500 mark, the recovery may be extended towards the psychological barrier of $1600. However, the moving averages at 9-day and 21-day may slow down the momentum and discourage the bulls from approaching the critical resistance levels of $1750, $1850, and $1950 as the 9-day MA crosses below the 21-day MA. On the other hand, a failure to break above the moving averages may result in a new bearish wave and bring the recent low of $1350 back into focus.
Nevertheless, the coin needs to recover above the moving averages which are currently at $1486 to elevate the immediate bearish pressure and improve the technical picture. More so, since the last few days, this area has been serving as strong support for the coin, which means the bulls may have a hard time taking it out. The support levels are located at $1200, $1100, and $1000 as the technical indicator RSI (14) remains around the 40-level.
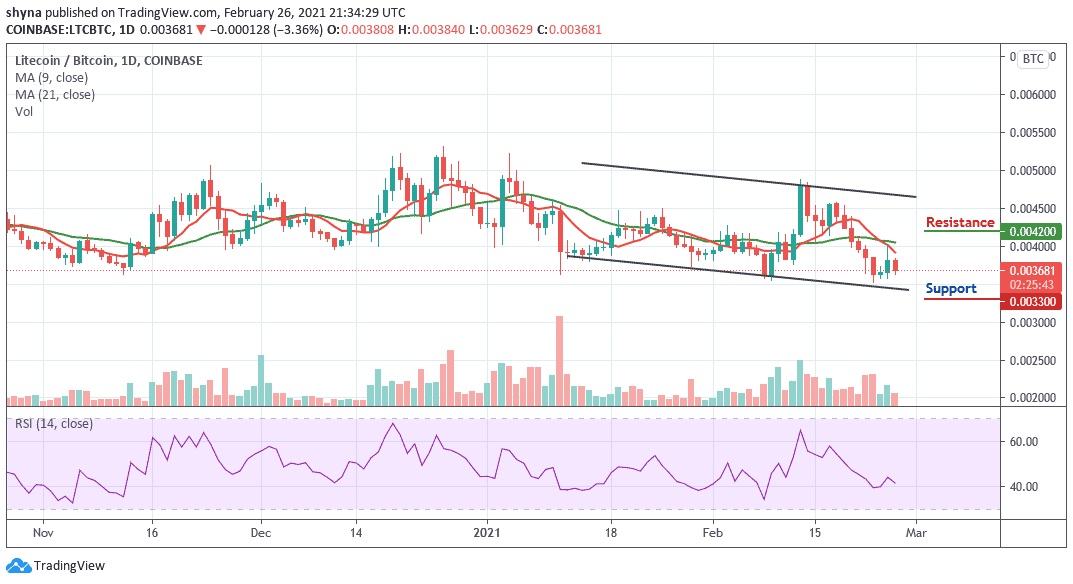
When compares with Bitcoin, the Ethereum price is still experiencing some difficulties for the past few days. The coin recently breaks below the 9-day and 21-day moving averages, trading around the lower boundary of the channel. Meanwhile, the critical support level is located at 2500 SAT and below.
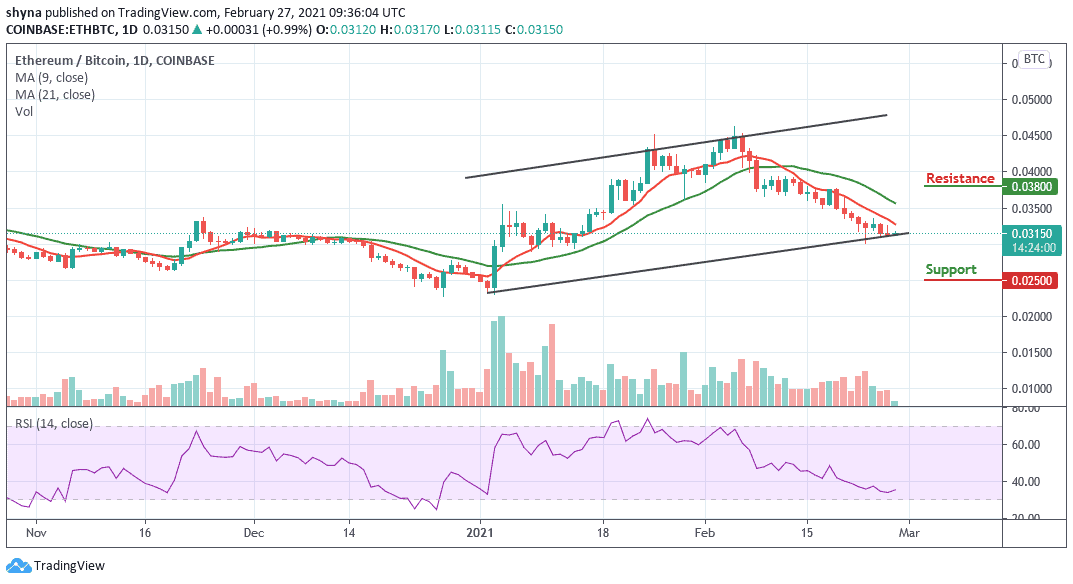
However, if the bulls power the market and move it above the moving averages, traders may soon find the resistance level at 3800 SAT and above. At the moment, the technical indicator RSI (14) still remains below the 40-level, which may keep the coin at the downside.
Join Our Telegram channel to stay up to date on breaking news coverage