Join Our Telegram channel to stay up to date on breaking news coverage
ETH Price Prediction – September 23
ETH/USD has been unable to see any relief following the massive influx of selling pressure that stopped it from seeing any further gains.
ETH/USD Market
Key Levels:
Resistance levels: $400, $420, $440
Support levels: $285, $265, $245
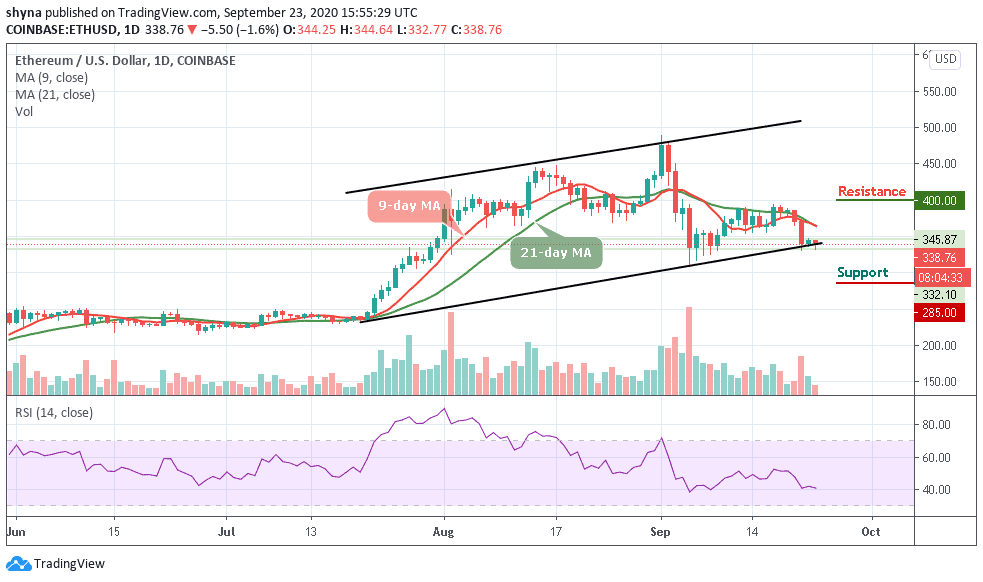
At the time of writing, ETH/USD is trading marginally at its current price of $338.76. This is the price at which it has been trading for the last few days. However, ETH trends in the short term are likely to be heavily reliant on BTC, as the benchmark crypto has had a firm grip on its smaller counterparts of late.
Would Ethereum Go up or Down?
ETH/USD has been able to establish the $332 region as a strong support zone. Every drop here has been faced with aggressive buying pressure. Therefore, if it sustains above this level, it could potentially start to navigate back to its resistance between the $350 and $380 levels. If the buying pressure evaporates around $335, it could see Ethereum incur some heavy downwards momentum that sends it to the supports at $285, $265, and $245.
In the meantime, it is important to note that all these losses that the coin has suffered have fundamentally changed the structure of the cryptocurrency market. Traders are to note that ETH/USD in the short term could be positioned to see a significant downside effect. Buyers should be on the lookout for $400, $420, and $440 as a target to watch and a strong bullish reaction at this level is vital for Ethereum to maintain its medium-term outlook while the RSI (14) is seen moving above the 40-level.
Against Bitcoin, we can see that Ethereum is clearly bearish. Meanwhile, as the price falls, the sellers are posing an additional threat for buyers to reach the support level of 0.032 BTC where the nearest target is located. However, an eventual break below the lower boundary of the channel may cause Ethereum to collapse.
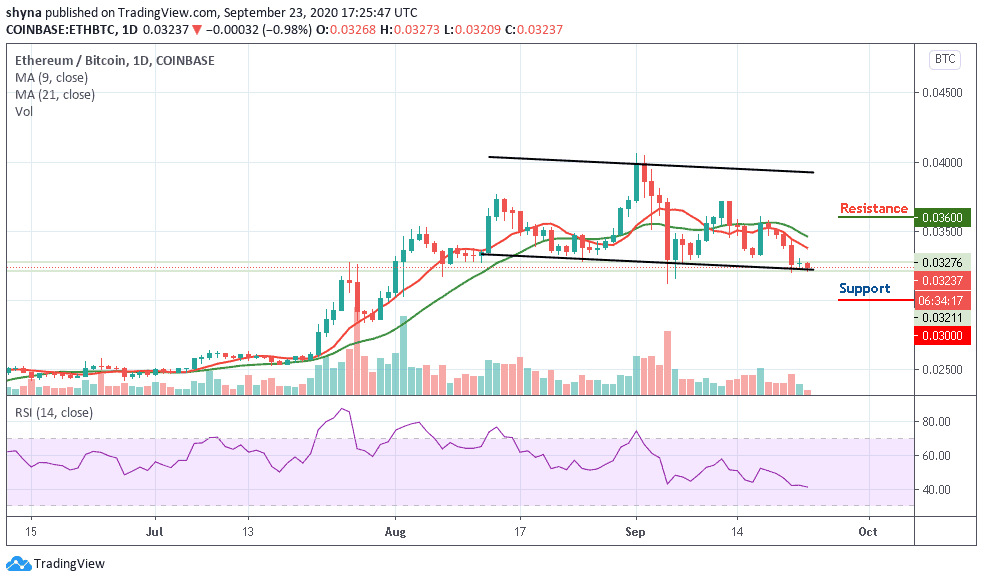
Meanwhile, the continuation of the downtrend could hit the main support at 0.0310 BTC before falling to 0.0300 BTC and below. More so, the buyers may likely push the market above the moving averages to reach the potential resistance at 0.0360 BTC and above if a rebound plays out. The RSI (14) is about to cross below the 40-level indicating that the sellers are in control.
Join Our Telegram channel to stay up to date on breaking news coverage