
Join Our Telegram channel to stay up to date on breaking news coverage
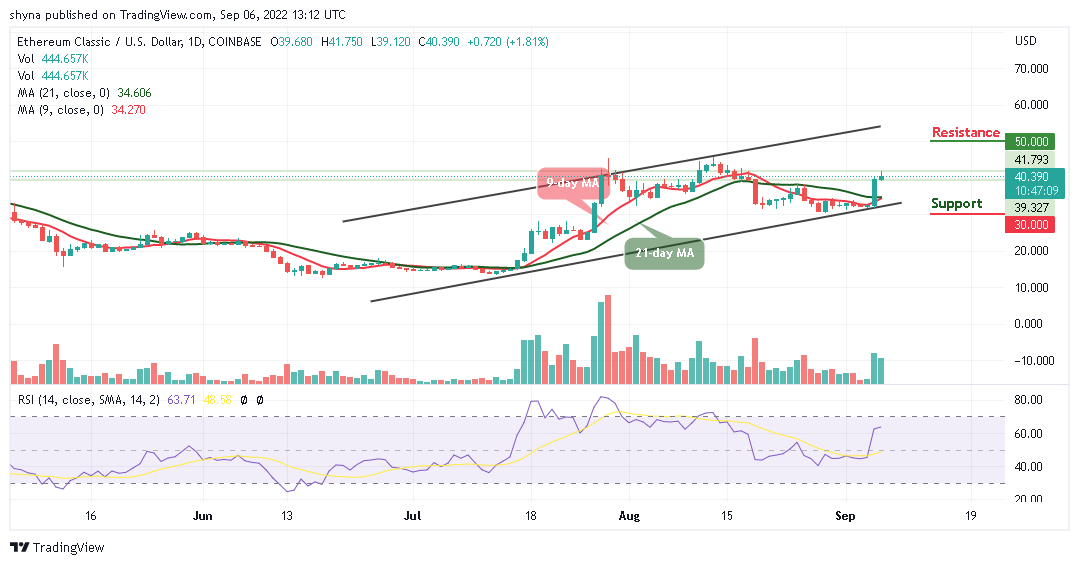
The Ethereum Classic price prediction spikes above the 9-day and 21-day moving averages as the coin touches the $41.7 high.
Ethereum Classic (ETC) Prediction Statistics Data:
- ETC price now – $40.3
- ETC market cap – $5.5 million
- ETC circulating supply – 136.7 million
- ETC total supply – 210.7 million
- ETC Coinmarketcap ranking – #17
ETC/USD Long-term Trend: Bullish (1D Chart)
Key Levels:
Resistance levels: $50, $55, $60
Support levels: $30, $25, $20
Your capital is at risk
ETC/USD is breaking to the positive side as the coin is posting gains of over 1.81% in the last 24 hours, with the coin trading above the 9-day and 21-day moving averages at $40.3 heading towards the upper boundary of the channel.
ETC Price Shoots to the Upside; TAMA Explodes Skywards
The Ethereum Classic price is heading to the upside as the coin heads toward the upper boundary of the channel. However, if the market continues the upward movement, the $45 resistance level is likely to surface. Nevertheless, ETC/USD may further look for higher price levels if the bulls continue to show commitment.
At the time of writing, the market is displaying a sign of subduing volatility within the channel. On the other hand, if ETC/USD decides to resume back under the control of bears, the price may likely locate the supports at $30, $25, and $20. The Relative Strength Index (14) is likely to move into the overbought region, the next resistance levels could be found at $50, $55, and $60 respectively.
Against Bitcoin, the Ethereum price is rising above the 9-day and 21-day moving averages. It is currently heading towards the upper boundary of the channel, aiming to hit the nearest resistance level of 2300 SAT. More so, moving near the upper boundary of the channel could hit the resistance level at 2500 SAT and above.
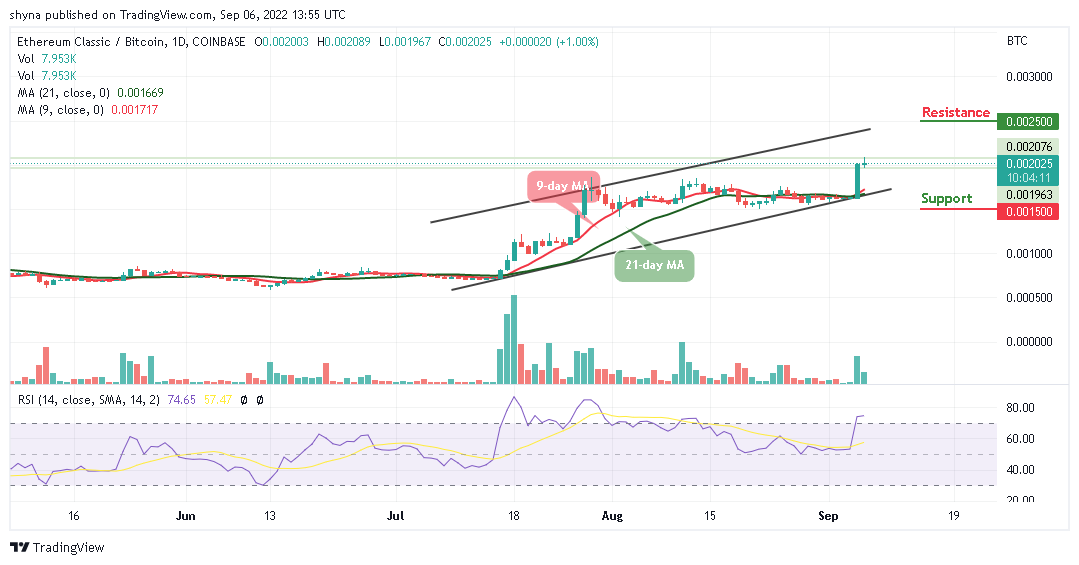
In the other words, any negative movement by the sellers to send the coin below the 9-day and 21-day moving averages may locate the support level at 1500 SAT and below. Meanwhile, the technical indicator Relative Strength Index (14) is moving within the overbought region which could increase the bullish movement within the channel.
Tamadoge is combining the fun of Tamagotchi with the play-to-earn mechanics made possible with NFT technology applied to gaming. Earlier this week the project completed the sixth phase on the project in which the coin was priced from 1 USDT to 44 TAMA. The price has since increased, to 1 USDT buying 40 TAMA. There will be nine tranches of token sales in all, with the price increasing at each stage. 711 million tokens have been sold so far out of a total of 1 billion that is available in the presale out of a total supply of 2 billion.
Related:
Join Our Telegram channel to stay up to date on breaking news coverage