Join Our Telegram channel to stay up to date on breaking news coverage
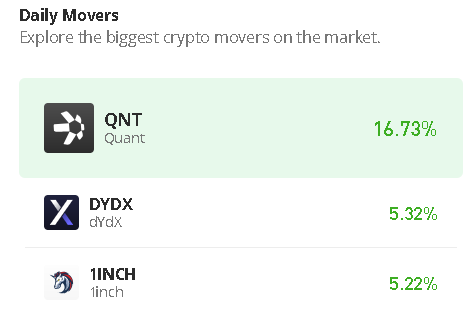
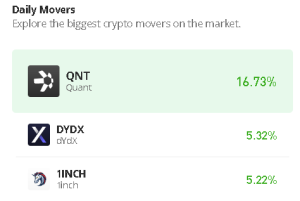
As the coin grows to the upside, the dYdX price prediction is likely to move consistently within the channel as the coin heads to the upside.
DYDX Prediction Statistics Data:
- DYDX price now – $1.72
- DYDX market cap – $269 million
- DYDX circulating supply – 156.2 million
- DYDX total supply – 1 billion
- DYDX Coinmarketcap ranking – #99
DYDX/USD Market
Key Levels:
Resistance levels: $2.50, $2.70, $2.90
Support levels: $0.90, $0.70, $0.50
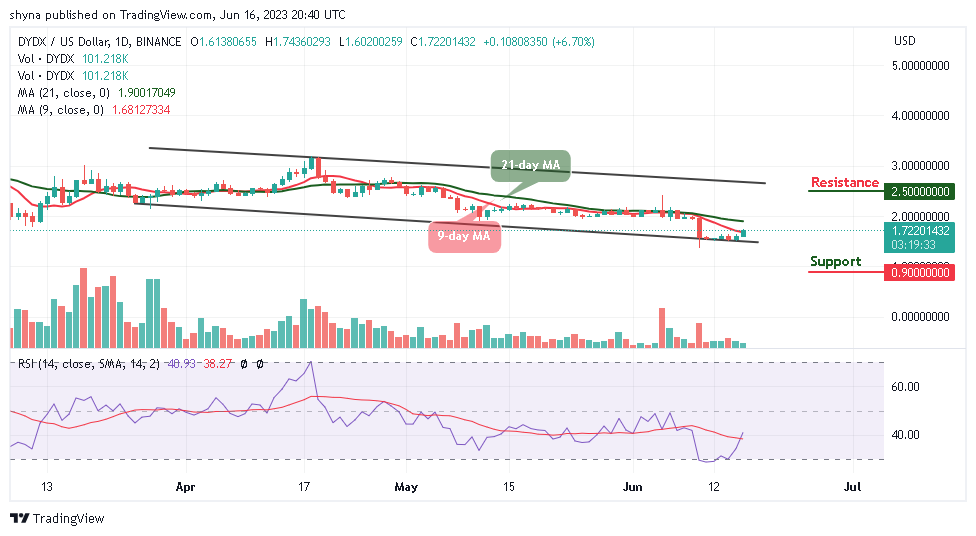
According to the daily chart, DYDX/USD is likely to cross above the 9-day and 21-day moving averages. In the last few days, the dYdX price has been struggling to cross into the positive side. As revealed by the daily chart, the technical indicator Relative Strength Index (14) is crossing above the 40-level, confirming the bullish movement for the coin.
DYDX Price Prediction: DYDX/USD Ready for the Upside
As the daily chart reveals, the dYdX price is currently moving to the north. If the coin continues with the bullish movement, the bulls may push the coin near the upper boundary of the channel to hit the resistance levels of $2.50, $2.70, and $2.90. At the time of writing, DYDX/USD shows a slight bullish movement within the daily chart.
On the contrary, if the coin slides below the lower boundary of the channel, it could return the coin to the support levels of $0.90, $0.70, and $0.50 respectively. Meanwhile, the long-term buyers should not be bothered by the small impact on the road, as the future of DYDX is assured as revealed by the technical indicator Relative Strength Index (14).
Against Bitcoin, the dYdX price is hovering near the 9-day moving average as the coin moves toward the positive side. The technical indicator Relative Strength index (14) is also confirming the bullish movement as the signal line moves to cross above the 40-level. On the contrary, a possible fall may surface if the technical indicator turns and faces downward, and it may cross below the lower boundary of the channel to hit the support level of 5000 SAT and below.

From above, any further bullish movement above the 21-day moving average could push the coin to the resistance level of 8000 SAT and above, this could take the coin to a new high, and the market may remain in the bullish zone for a while.
dYdX Alternatives
The dYdX price is likely to cross above the 9-day and 21-day moving averages if the buyers could increase the buying pressure. For the fact that the coin is trading at $1.72, the dYdX price may continue to follow the bullish movement. Therefore, traders can expect the coin to cross above the moving averages to hit the nearest resistance level of $3.00. Meanwhile, investors must consider that all presales carry risk. However, Wall Street Memes has already proven itself as one of the best presales, potentially setting the tone for its future as almost $8 million has been raised in the ongoing presale.
New OKX Listing - Wall Street Memes

- Established Community of Stocks & Crypto Traders
- Featured on Cointelegraph, CoinMarketCap, Yahoo Finance
- Rated Best Crypto to Buy Now In Meme Coin Sector
- Team Behind OpenSea NFT Collection - Wall St Bulls
- Tweets Replied to by Elon Musk
Join Our Telegram channel to stay up to date on breaking news coverage