
Join Our Telegram channel to stay up to date on breaking news coverage
DOT price action currently lacks the vigor to reach higher resistance. Additionally, we can perceive that the volatility of price action is very low in this market. Also, trading indicators aren’t portraying serious signs of an upside price movement
Polkadot’s Forecast Statistics Data:
Polkadot’s current price: is $ 6.97
Polkadot’s market capitalization: $8.03billion
Polkadot’s Circulating supply: 1.11 billion
Polkadot’s Total supply: $1.23 billion
Polkadot’s Coinmarketcap ranking: #11
However, in this analysis, we’ll try to examine the activities here and try to find a better way to approach this market. We shall also consider the DOT/BTC market and we’ll try to provide better ways of navigating this market.
Major Price Marks:
Resistance levels: $7.00, $7.50, $8.00
Support levels: $6.97, $6.50, $6.00
DOT Minimally Retraced Lower Resistance, Buy TAMA, and Buy Long
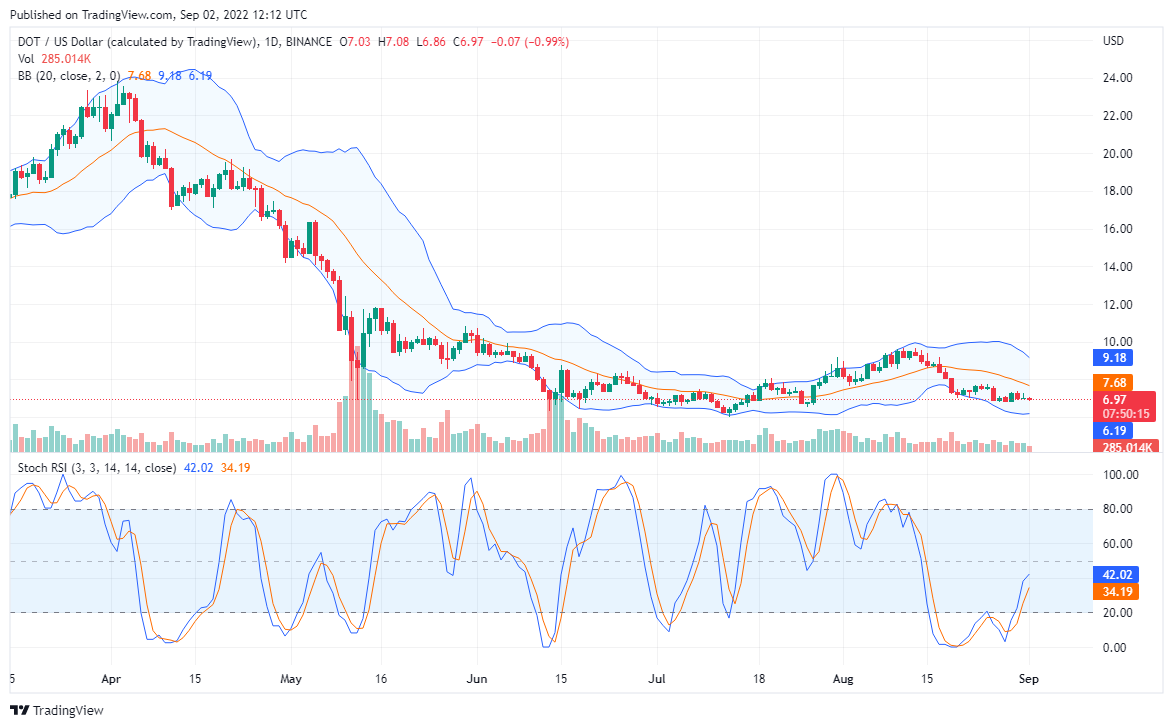
DOT/USD price chart portrays that the crypto is lacking in bullish activities. Consequently, this has caused it to stay down for a significant length of time. Furthermore, even now indicators are still portraying that the price of this crypto may fall lower still. Looking at the chart, price activity is significantly below the MA of the Bollinger indicator. Also, the Bollinger indicator itself generally points downwards, which indicates the general market direction. The second to the last candle on this chart indicated a bullish reversal, subsequently, this has caused the RSI curves to point upwards slower one, indicating a gain in upward momentum. However, the subsequent price candle appears bearish. Consequently, this caused a minor correction on the faster line of the Bollinger indicator. At this point we can expect Two things here should buying pressure continue to increase then price will rise to around $7.68. And, secondly, if selling pressure continues then the price will keep finding lower support around $6.40 or below.
Polkadot Price Analysis: DOT/BTC Appears Undecided
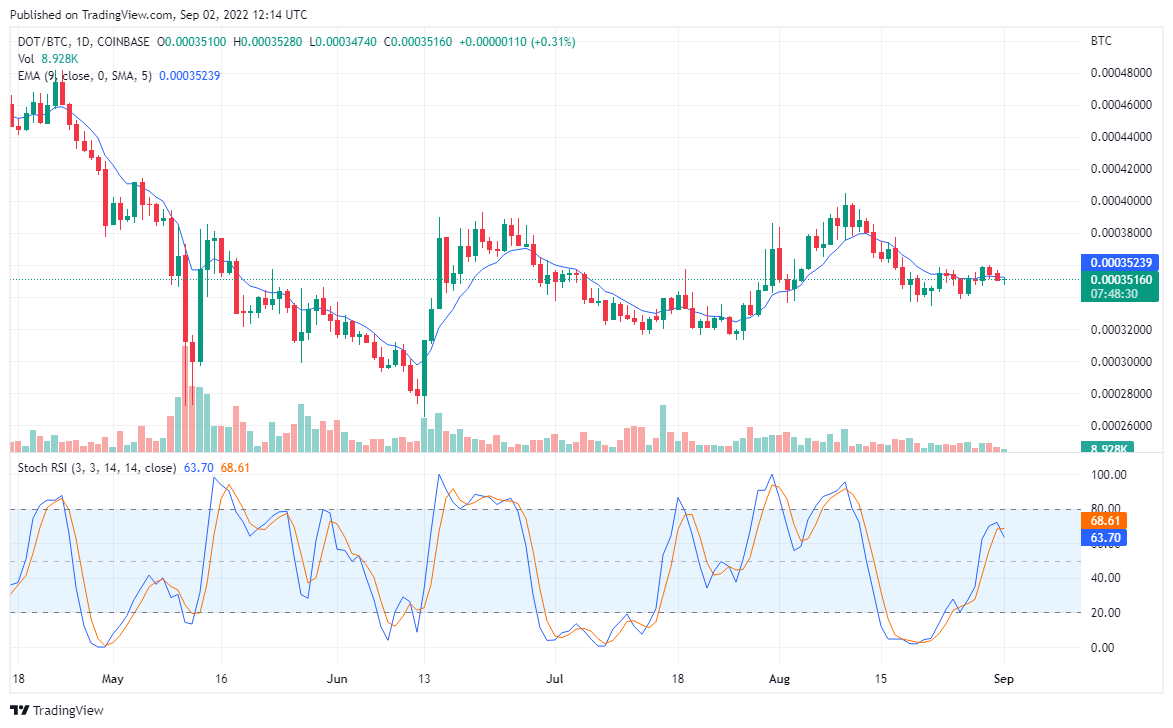
Examining the DOT/BTC chart, indicators here are already indicating a downtrend, even when the last candle here portrays a bullish reversal. The EMA line has resumed it position above the price candle. Although, the distance between the EMA lines and price candle is very small. And additionally buying pressure will push price activity above it. Nevertheless, traders should anticipate that a price will rise, going by the last candle on the chart.
Your capital is at risk
Additionally, the Stochastic RSI indicator curves have crossed to indicate a downturn in price action. If selling should continue as indicated by this Indicator, then DOT/BTC value will retrace lower support around 0.0003300. However, should the bullish reversal progresses as indicated by the last candle on this chart then value action will retrace higher resistance around 0.0003600. At this point, traders will have to wait for more confirmation of either an up or downtrend.
The newest Doge on the block, Tamadoge is coming out the gate barking, becoming one of the biggest hyped meme coins of all time and pushing the boundaries of the Play-to-Earn space, in order to provide a game that people will be climbing over each other to use.
Related
Join Our Telegram channel to stay up to date on breaking news coverage