Join Our Telegram channel to stay up to date on breaking news coverage
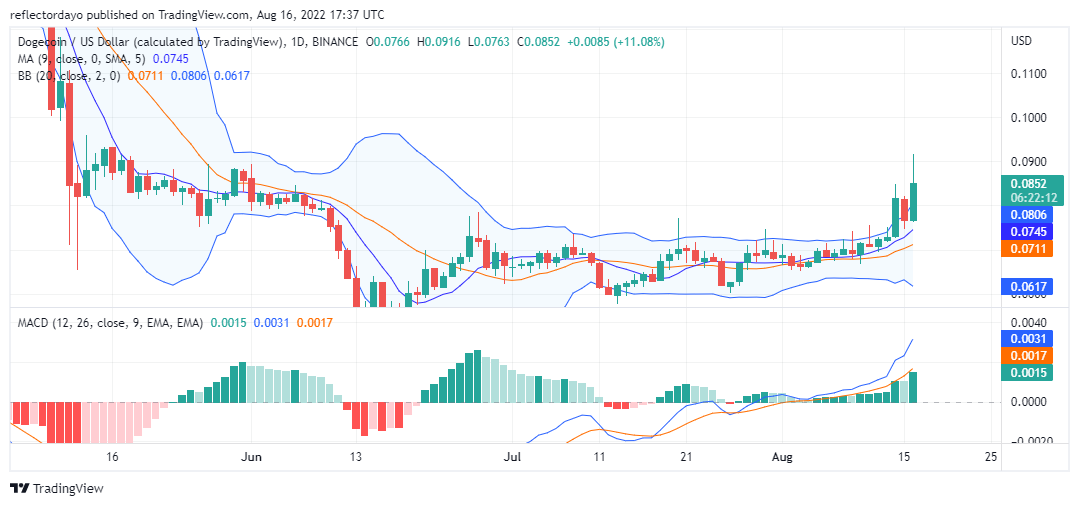
On the 14th of August, there was a very strong DOGE/USD bullish market behaviour. Yesterday’s trend was weakened by strong bearish price activities, but today the bulls regain their balance and continue to push the trend of the market to the upside. Dogecoin’s general trend for the past few days is of a sideway ranging market behaviour. The market is undecided about which direction to swing to. This continued until the 14th of August.
Dogecoin Price Data
- DOGE/USD price now: $0.08416
- DOGE/USD market cap: $11,149,818,782
- DOGE/USD circulating supply: 132,670,764,300DOGE
- DOGE/USD Total supply: 132,670,764,300DOGE
- DOGE/USD coin market cap ranking: #10
Key Levels
- Resistance: $0.0698, $0.0716, $0.0847
- Support: $0.0729, $0.0677 $0.0658
Your capital is at risk
DOGE/USD Price Prediction: What the Indicators Are Saying About the Market Behaviour
According to the indication of the Bollinger band, we see the two bullish candlesticks popping out of the boundary of the indicator. This confirms that the market is very bullish and the price Is likely to correct to the confines of the upper boundary of the band. The MACD line shows very strong market momentum. The histogram shows a strong bar that measures a difference of 0.0015 between the MACD line and the signal line. Going by this information, the prices of Dogecoin soon break the 0.0900 resistance level.
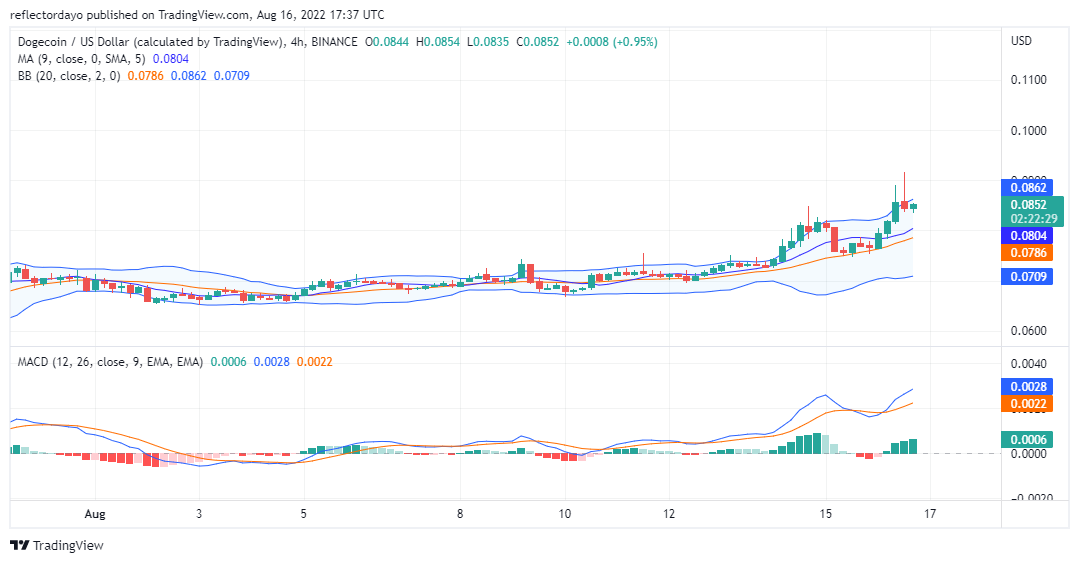
DOGE/USD Price Prediction: The 4-Hour Chart Point of View
On the 4-hour chart, the first three trading session was very bullish, then the bears takes over. The bears are pushing the popping candlestick within the limit of the Bollinger band indicator. The MACD shows that the strength of the bulls is reducing. On a general outlook, Dogecoin’s value is on the rise.
Related
Join Our Telegram channel to stay up to date on breaking news coverage
