
Join Our Telegram channel to stay up to date on breaking news coverage
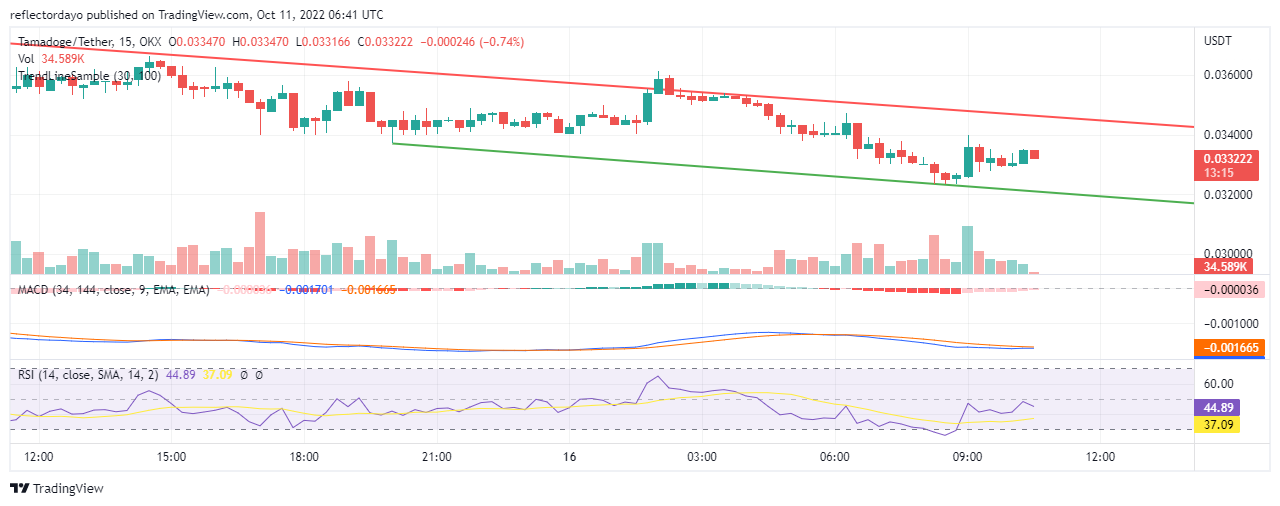
In the 8th hour of today’s trading session, the TAMA market hit a new support level at $0.0324. Since then the market took this as the basis for the bullish trend performance. In the 9th hour of today’s trading session, a very significant bullish candle appears on the chart. This was followed by a significant bearish candle. but the bulls were quick to salvage the market
Tamadoge Market Price Statistic:
- TAMA/USD price now: $0.0354
- TAMA/USD market cap: $37,417,929
- TAMA/USD circulating supply:1.05Billion
- TAMA/USD total supply: 1,049,733,333
- TAMA/USD coin market ranking: #2674
Key Levels
- Resistance: $0.0400, $0.0500, $0.0600
- Support: $0.0300, $0.0400, $0.0450
Tamadoge Market Price Analysis: The Indicators’ Point of View
TAMA market is establishing new higher support levels after the bearish trend was cut short at around the 8th hour of today’s trading session. The next support was at around the 10th hour of today’s trading session. Consequently, the bullish histograms are beginning to appear on the positive side of the MACD indicator, although the lines of the indicator are still far below level zero. RSI line has now crossed into the bullish zone at 51.8%
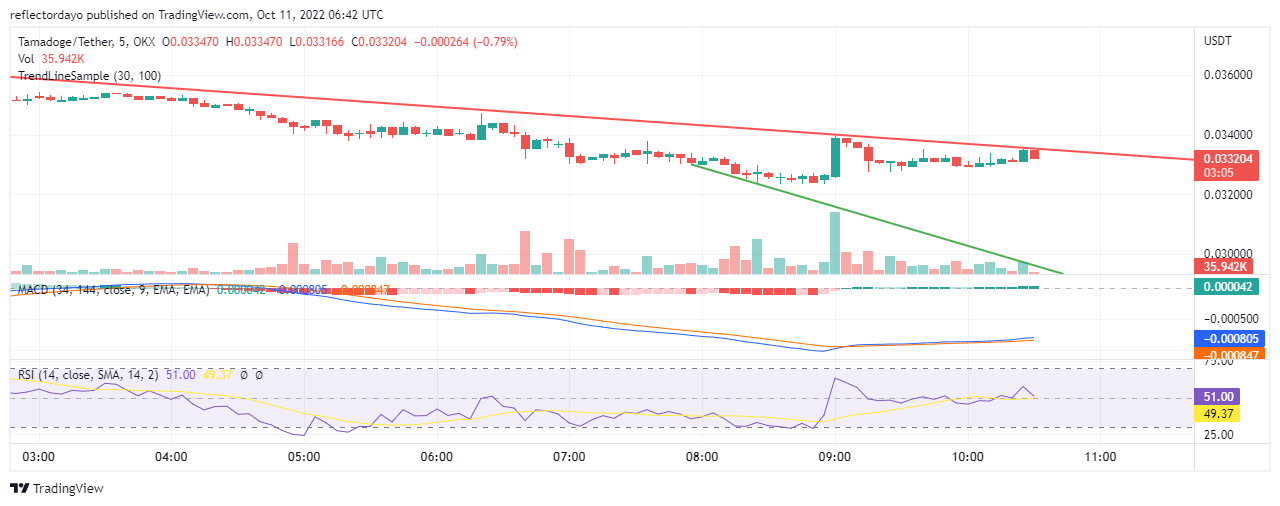
Tamadoge: TAMA/USD 5-Minute Chart Outlook
From this outlook, we can see the TAMA market is performing with higher support. But, the resistance price level continues on a horizontal pattern. This market behaviour is now forming an ascending triangle pattern. This is a major concern as the bullish trend is still just getting started. However, RSI signal line continues steadily at 58.6%. With more bullish support, the market price should continue on its upside movement
Join Our Telegram channel to stay up to date on breaking news coverage