
Join Our Telegram channel to stay up to date on breaking news coverage
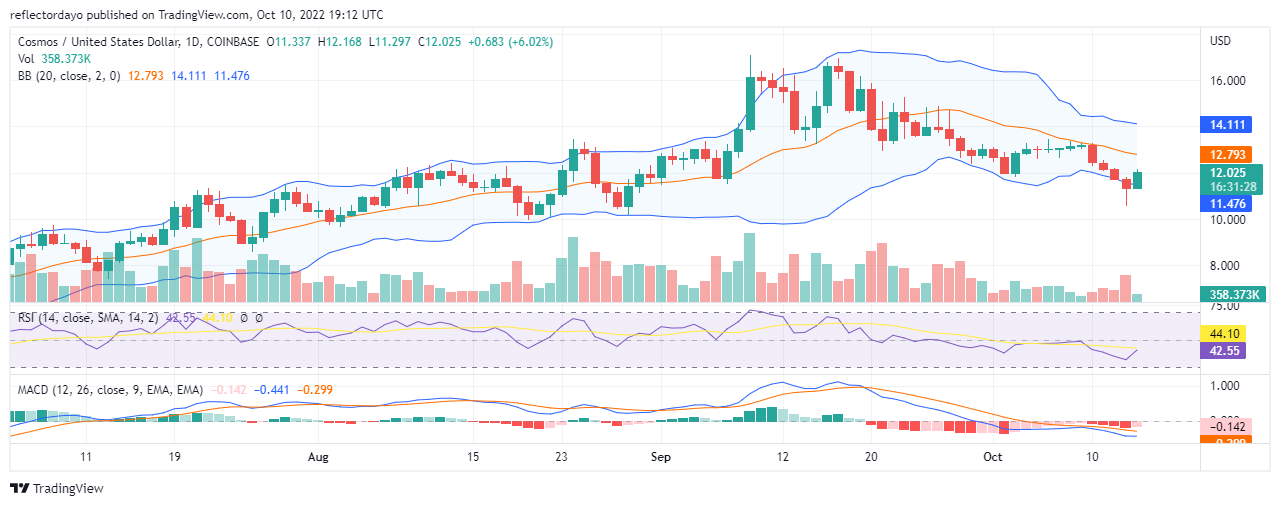
Cosmos bulls attempted a bullish trend on the 3rd of October. But their advances were strongly rejected for six days. This resulted in a side-way ranging market. However, during those 6 days, it was looking like the market would break out in a bullish way, but the market eventually broke out in a bearish way. Now, it appears like the market is now resuming the bullish trend which it could not pull up due to bearish resistance.
Cosmos Market Price Statistic:
- ATOM/USD price now: $11.99
- ATOM/USD market cap: $3,440,098,371
- ATOM/USD circulating supply: 286,370,297
- ATOM/USD total supply: Not Available
- ATOM/USD coin market ranking: #22
Key Levels
- Resistance: $ 12.000, $12.500 $13.000
- Support: $11.000, $10.500, $10.000
Your capital is at risk
Cosmos Market Price Analysis: The Indicators’ Point of View
From the 3rd of October to the 9th of October, the RSI line (fast curve) and the signal line (slow curve) moved together at the midpoint of the indicator which separated the bullish market from the bearish market. This was in response to the price consolidation in the ATOM/USD market. The RSI line made a sharp fall as the bears prevailed from the 10th of October to the 13th of October. However, now, in response to the bullish activities in the cosmos market today, the lines are rising again with strong momentum.
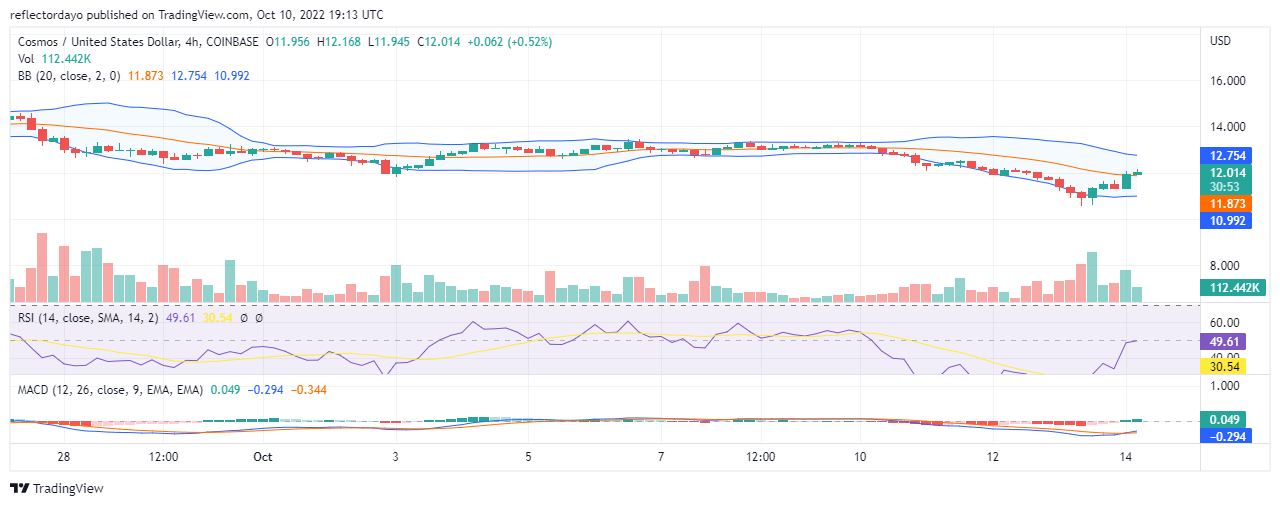
Cosmos 4-Hour Chart Outlook
According to the MACD indicator in this outlook, the market has recorded bearish histograms for a while. Due to the indecision in the market, the negative histograms continue to change colours between red and pink. This portrays a market struggle in which bears have been having the upper hand. However, as we are beginning to see bullish activities in the market, it may be that the trend reversal is about to begin to favour the bulls.
Join Our Telegram channel to stay up to date on breaking news coverage