Join Our Telegram channel to stay up to date on breaking news coverage
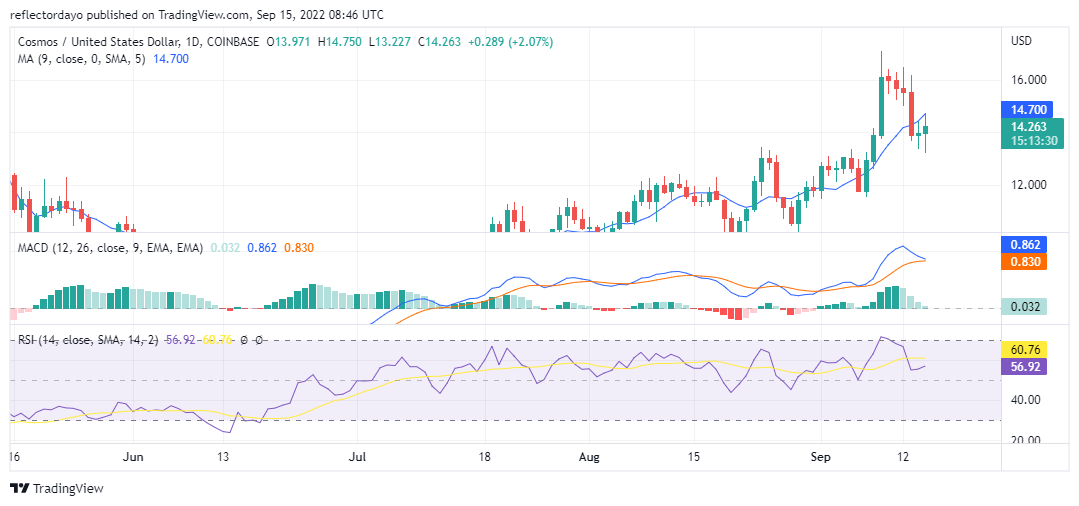
On the 9th of September, the price of ATOM/USD reached the height of $17.210 after the price broke the resistance level of $16.000. At that peak, traders decided to take profits; this made the price fall from then up until 13th September when the price closed at $13.847. Buyers recovered the market on the 14th of September, but it was a narrow win for them. Sellers are still formidable in the market and they can still change the direction of the market from the upside to the downside. However, for now, the buyers are still having the upper hand
Cosmos Market Price Statistic:
- ATOM/USD price now: $14.367
- ATOM /USD market cap: $4,134,761,151
- ATOM /USD circulating supply: 286,370,297.00
- ATOM /USD total supply: Information is not available
- ATOM /USD coin market ranking: #22
Key Levels
- Resistance: $15.000, $16.000, $17.000
- Support: $13.000, $12.000, $11.000
Your capital is at risk
Cosmos Market Price Analysis: The Indicators’ Point of View
The MACD line changed direction to the lower levels in response to the movement of price action on the 12th of September due to the bearish pressure. And the line is now close to crossing the MACD signal line, but in response to today’s bullish market movement, the line is slowing down to find its direction to the upside. This same indication is reflected in the Relative Strength Index, RSI line is also trying to seek an upper level. Although these indicators are telling us that buyers are becoming stronger in the market, we must also consider the implication of the outlook of today’s candlestick. It tells us that the sellers are still formidable.
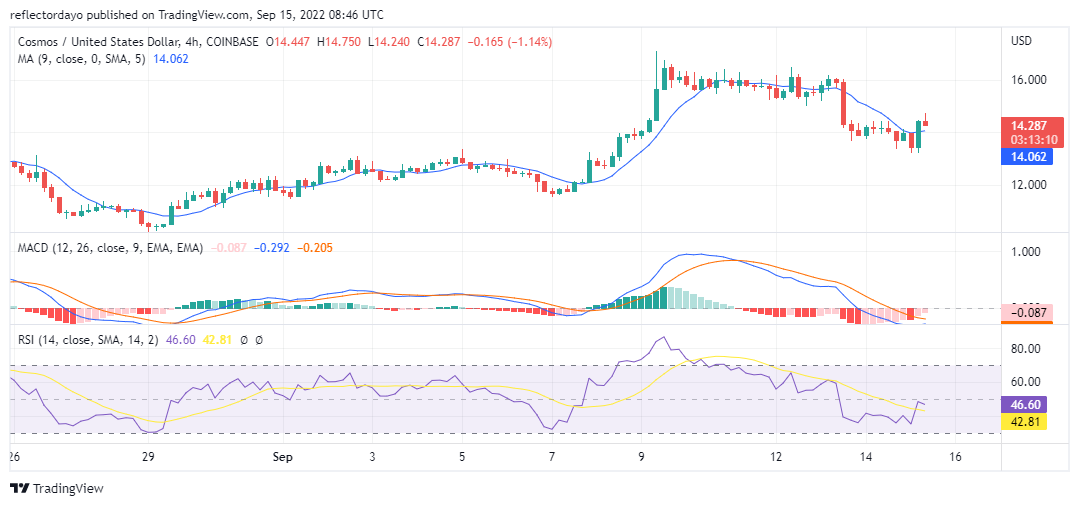
Cosmos: ATOM/USD 4-Hour Chart Outlook
From this time frame, we discovered from the MACD indicator that the market is already on the downside trying to recover to the upside. And the attempt at the market recovery is being slowed down by the selling pressure. But for now, the selling pressure is not as strong as the buying pressure in the market. This is evident in the last two MACD pink histograms. If the buyers keep having the upper hand in today’s market the price will find a new level.
Related
Join Our Telegram channel to stay up to date on breaking news coverage