Join Our Telegram channel to stay up to date on breaking news coverage
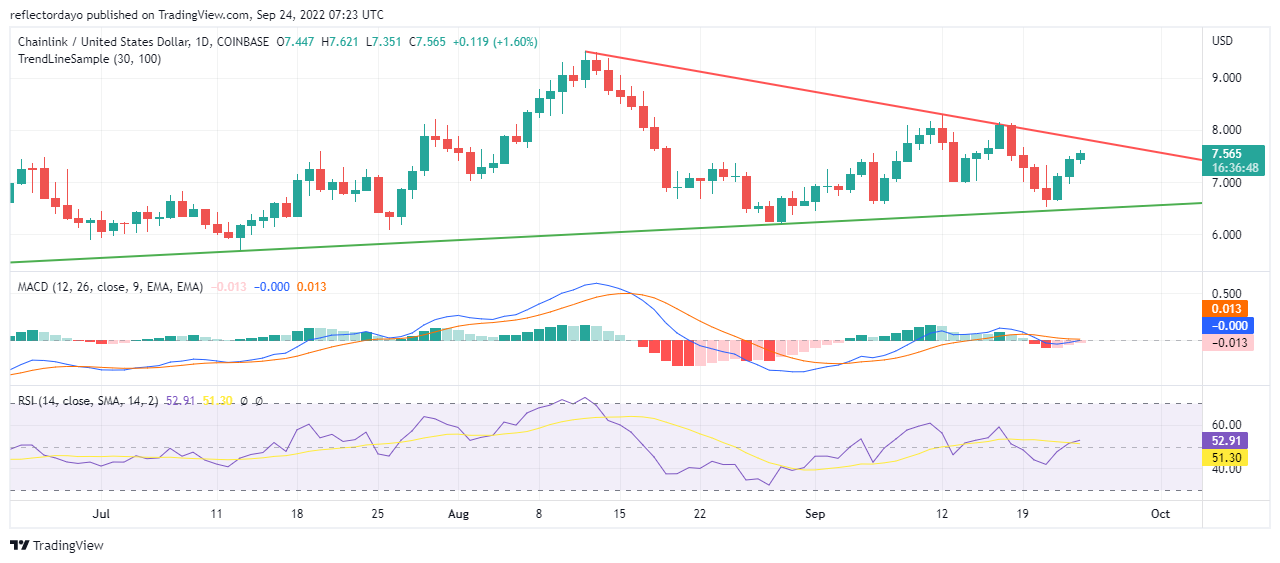
The downtrend that began on the 13th of August continues till now. But as LINK/USD buyers mount pressure, the two market forces are getting even. And this is resulting in a convergence of the support and resistance of the market. The market may be moving into a price consolidation period.
Chainlink Market Price Statistic:
- LINK/USD price now: $7.58
- LINK/USD market cap: $3,724,707,545.99
- LINK/USD circulating supply:491,599,970
- LINK/USD total supply: 1,000,000,000
- LINK/USD coin market ranking: #23
Key Levels
- Resistance: $8.000, $8.500, $9.0000
- Support: $7.500, $7.0000, $6.5000
Your capital is at risk
Chainlink Market Price Analysis: The Indicators’ Point of View
The Moving Average Convergence and Divergence indicate that the market is consolidating. The MACD line, the Signal line and the histograms are now preparing to converge at point zero (Point of equilibrium). Before this, the market swung erratically. But now, the erratic swings are reducing as the market progresses. The RSI indicator confirms this same sentiment. The RSI line and the Signal line are at the midpoint of the indicator.
Chainlink: LINK/USD 4-Hour Chart Outlook
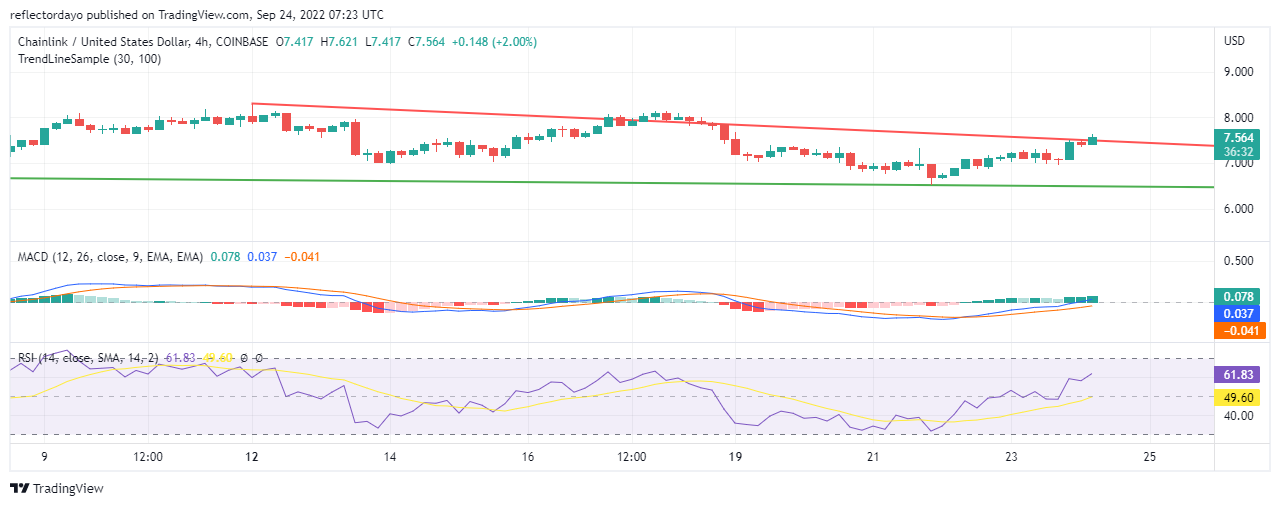
The Outlook of the 4-hour session is an up-trending market. The MACD shows that the price is recovering from the bearish market to an upward market. Also in the RSI, the RSI line and the signal line rises from the weaker zone of the indicator. As the market enters the consolidation period, we can expect a decisive directional market price breakout after the period.
Join Our Telegram channel to stay up to date on breaking news coverage
