
Join Our Telegram channel to stay up to date on breaking news coverage
The Cartesi price prediction shows that CTSI could renew the bullish trend after testing the support level of $0.16 today.
Cartesi Prediction Statistics Data:
- Cartesi price now – $0.16
- Cartesi market cap – $123.6 million
- Cartesi circulating supply – 732.8 million
- Cartesi total supply – 1 billion
- Cartesi Coinmarketcap ranking – #182
CTSI/USD Market
Key Levels:
Resistance levels: $0.30, $0.32, $0.34
Support levels: $0.05, $0.03, $0.01
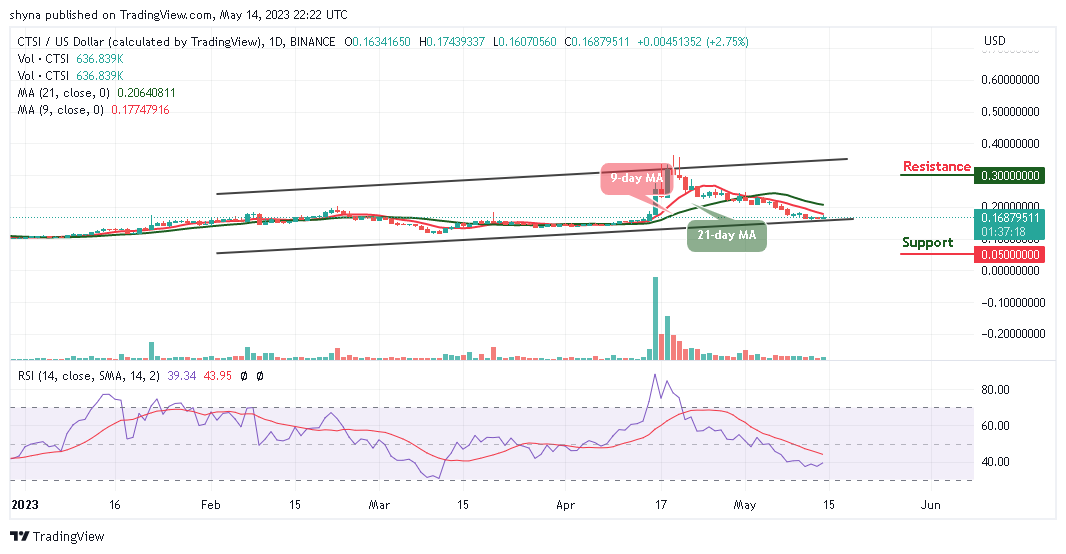
CTSI/USD has been hovering around $0.16 after touching the daily high of $0.17. The Cartesi price is currently changing hands below the 9-day and 21-day moving averages but, with a slight gain of 2.75% since the start of the day. Despite the recovery, the coin is still hovering below the daily of $0.17.
Cartesi Price Prediction: What Could Be the Next Direction for Cartesi Price?
According to the daily chart, the Cartesi price is moving towards the resistance level of $0.20 as the initial move toward the upper boundary of the channel could boost the price further up. The Cartesi (CTSI) hits the daily high at $0.17 before retreating to where it is currently trading. Looking at it from above, more bullish movements may come into play if the Cartesi price moves near the upper boundary of the channel, and the nearest resistance level could be found at $0.25.
However, traders can see that the daily movement remains in the hands of the bulls and the technical indicator Relative Strength Index (14) is likely to cross above the 40-level. Meanwhile, a break into the positive side may most likely push the coin towards the potential resistance levels of $0.30, $0.32, and $034, while a drop below the lower boundary of the channel may lead to the supports of $0.05, $0.03, and $0.01 respectively.
Against Bitcoin, the Cartesi is seen moving sideways below the 9-day and 21-day moving averages. After the coin touches the daily high at 643 SAT today, the coin later retreated to where it is currently trading. Meanwhile, the price keeps moving sideways as the buyers may put pressure on the market.
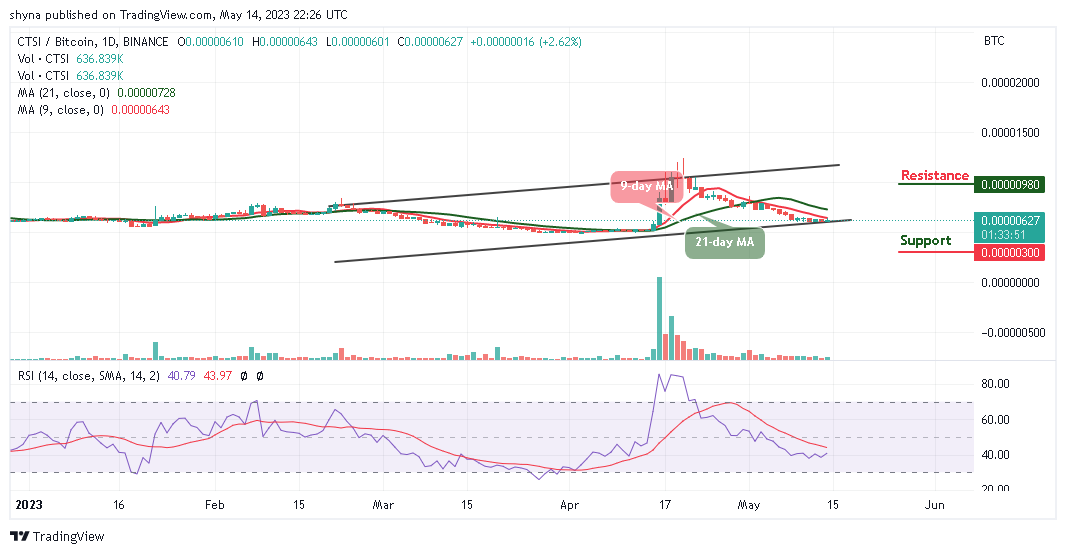
Moreover, should the sellers return to the market, the Cartesi price may drop to the support of 300 SAT and below. Now, the technical indicator Relative Strength Index (14) moves to cross above the 40-level as the market could face the upward movement in the next positive direction while the resistance level could be located at $980 and above.
Cartesi Alternatives
The Cartesi price may cross above the moving averages. However, if CTSI/USD breaks toward the channel, it could visit an important resistance at $0.25. Therefore, a successful break above this level could open another increase above the $0.30 level. Nevertheless, AiDoge is a crypto startup, meaning it requires funding from investors to achieve its goals. This is why AiDoge has just launched its much-anticipated presale campaign. AiDoge is a crypto startup, meaning it requires funding from investors to achieve its goals. This is why AiDoge has just launched its much-anticipated presale campaign raising almost $9 million so far.
Join Our Telegram channel to stay up to date on breaking news coverage