Join Our Telegram channel to stay up to date on breaking news coverage
The Cardano price prediction may lack short-term and medium-term support but if the price rises even further, the coin is likely to face up.
Cardano Prediction Statistics Data:
- Cardano price now – $0.37
- Cardano market cap – $12.8 billion
- Cardano circulating supply – 34.2 billion
- Cardano total supply – 35 billion
- Cardano Coinmarketcap ranking – #8
ADA/USD Market
Key Levels:
Resistance levels: $0.47, $0.49, $0.51
Support levels: $0.30, $0.28, $0.26
Your capital is at risk
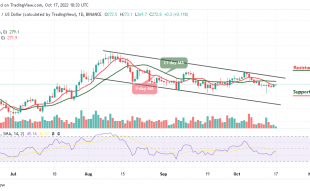
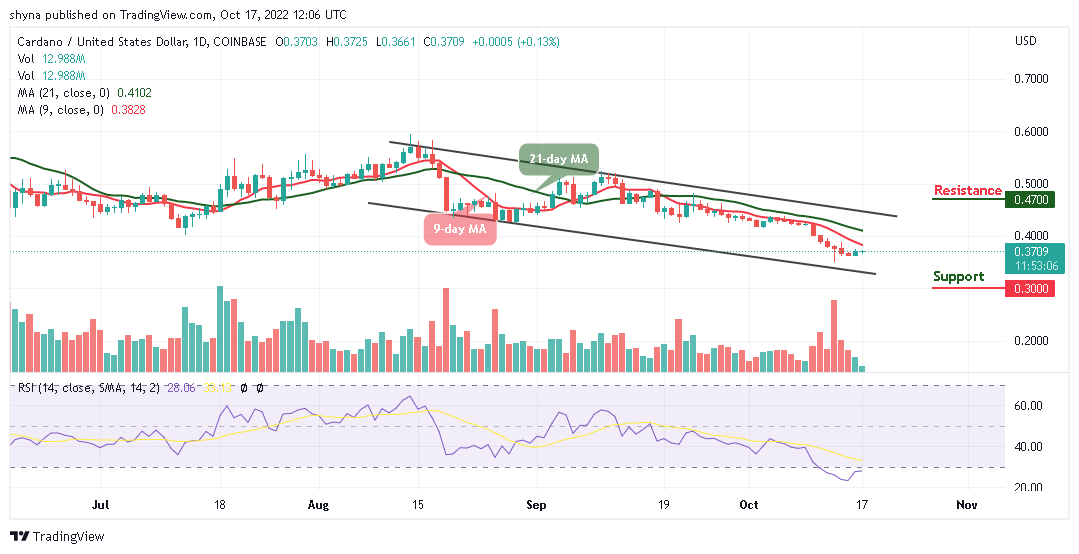
ADA/USD is trading around the $0.37 resistance level but the coin remains below the 9-day and 21-day moving averages. However, if the bulls push the market price above the 9-day MA, the nearest resistance may be located around $0.44. Moreover, if the bullish movement increases, additional resistance could be found above the upper boundary of the channel.
Cardano Price Prediction: Cardano (ADA) May Break to the Upside
At the time of writing, traders could see that the Cardano price may create more bullish trends once the coin crosses above the 9-day and 21-day moving averages and this is noticeable as the technical indicator Relative Strength Index (14) is moving out of the oversold region.
Looking at the daily chart, the market decides to rebounds from the daily low of $0.36 but any bearish movement below this level could lead the coin to another downtrend. However, the support levels for the coin could be found at $0.30, $0.28, and $0.26, while the resistance levels lie at $0.47, $0.49, and $0.51 respectively.
Against Bitcoin, the Cardano price is hovering below the 9-day and 21-day moving averages. The nearest resistance level could be found at 2000 SAT because the market price is still changing below the 9-day MA. Looking at it technically, the market price may continue to move sideways within the channel as the technical indicator Relative Strength Index (14) moves within the oversold region.
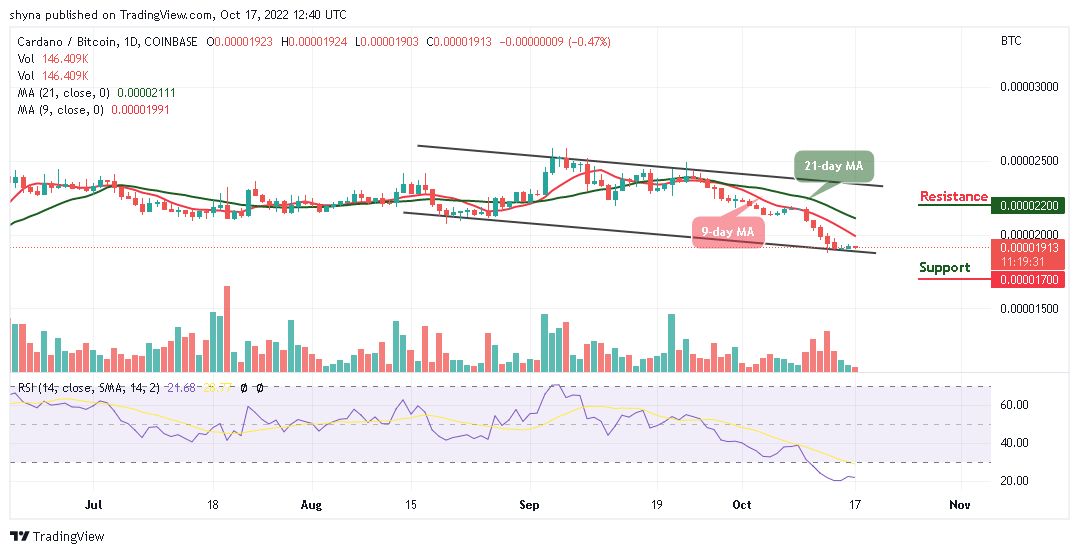
However, if the Cardano price remains below the moving averages, ADA/BTC may likely cross below the lower boundary of the channel to hit the support level of 1700 SAT and below. But, any bullish movement above the moving averages may allow the market to form a new uptrend which could hit the potential resistance at 2200 SAT and above.
Join Our Telegram channel to stay up to date on breaking news coverage