Join Our Telegram channel to stay up to date on breaking news coverage
The Cardano price prediction may lack short-term, but if the price rises, the coin is likely to create more gains above the channel.
Cardano Prediction Statistics Data:
- Cardano price now – $0.53
- Cardano market cap – $18 billion
- Cardano circulating supply – 33.7 billion
- Cardano total supply – 34.2 billion
- Cardano Coinmarketcap ranking – #7
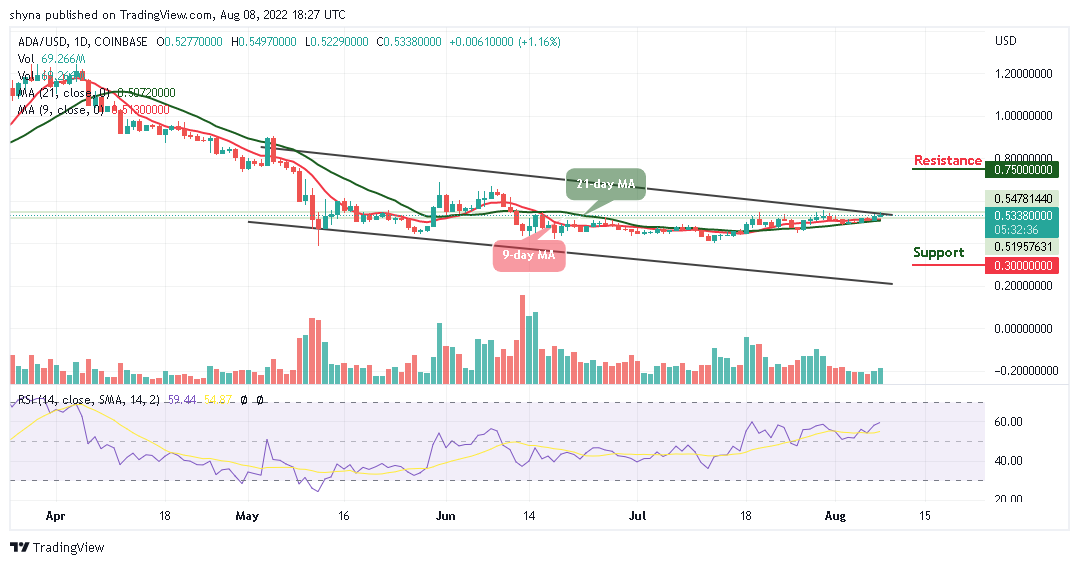
ADA/USD Market
Key Levels:
Resistance levels: $0.75, $0.80, $0.85
Support levels: $0.30, $0.25, $0.20
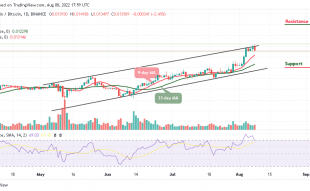
ADA/USD is currently trading around the $0.53 level above the 9-day and 21-day moving averages. In the range of the descending channel, the closest support is located at $0.50, with a close resistance at $0.54. Meanwhile, if the market increases, additional resistance can be found above the upper boundary of the channel.
Cardano Price Prediction: Cardano Ready to Push the Upside
According to the daily chart, the Cardano price may create more bullish trends once the coin crosses above the channel, and this is noticeable for the technical indicator Relative Strength Index (14) as the signal line may cross above the 60-level. Since a few days ago, Cardano (ADA) has been moving in the same direction as the market ranges.
At the moment, the market is trading at $0.53 above the 9-day and 21-day moving averages, but any bearish movement below the daily low of $0.52 could lead the coin to a serious downtrend. However, the support levels could be located at $0.30, $0.25, and $0.20, while the resistance levels lie at $0.75, $0.80, and $0.85 respectively.
ADA/BTC Market: Price Moves Sideways
Against Bitcoin, the support level of this range is built around 2200 SAT. The resistance is set at 2300 SAT because the market price is still changing towards the 9-day and 21-day moving averages. Technically, the price continues moving sideways within the channel and the technical indicator Relative Strength Index (14) may slide below the 50-level.
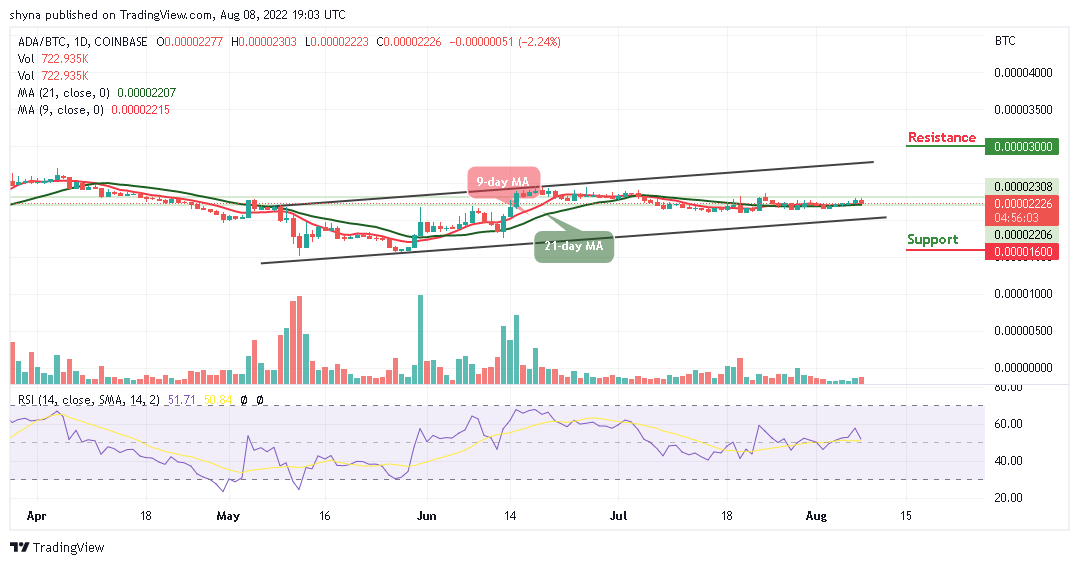
However, if the Cardano price crosses below the lower boundary of the channel, ADA/BTC may likely hit the support level of 1600 SAT and below. On the contrary, any bullish movement above the upper boundary of the channel may allow the market to form a new upward trend, and this could reach the potential resistance at 3000 SAT and above.
Read more:
Join Our Telegram channel to stay up to date on breaking news coverage