Join Our Telegram channel to stay up to date on breaking news coverage
Bitcoin (BTC) Price Prediction – September 3
The cryptocurrency market becomes a sea of red, with nearly all assets suffering in the greater market collapse.
BTC/USD Long-term Trend: Ranging (Daily Chart)
Key levels:
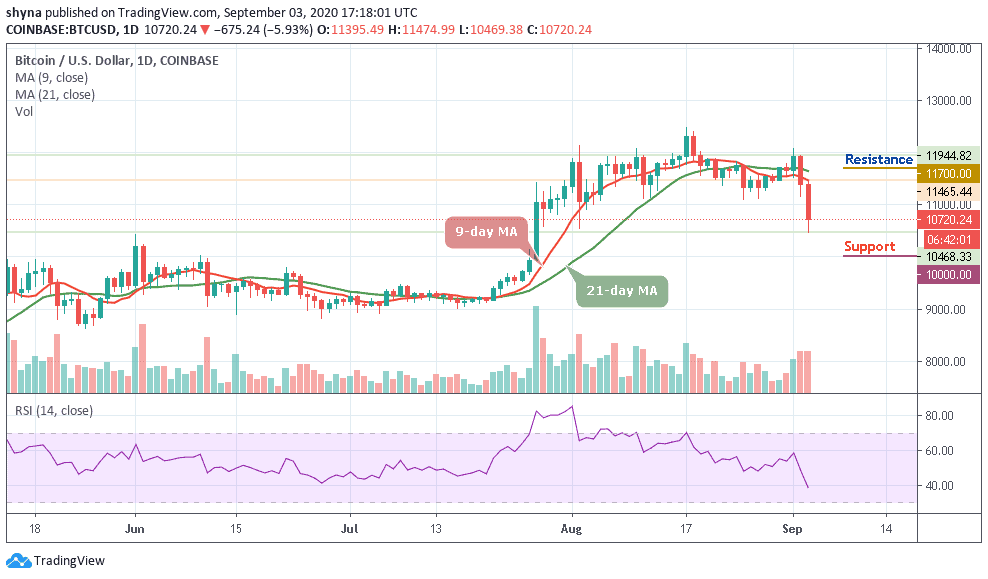
Resistance Levels: $11,700, $11,900, $12,100
Support Levels: $10,000, $9,800, $9,600
BTC/USD just two days ago was trading above the $12,000 level, but a failure to hold above the key resistance level sent the cryptocurrency tumbling. In the last few moments, the first digital asset fell below $11,000 for the first time in over a month. However, is it possible for the bulls to hold this important support?
Where is BTC Price Going Next?
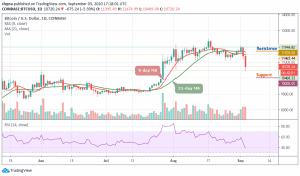
The last trip to the $12,000 level could be the last for some time, now that the Bitcoin (BTC) is trading at $10,720 under the 9-day and 21-day moving averages. The reasons for the sudden and sharp decline in Bitcoin include a strong rebound in the dollar, growing uncertainty surrounding the upcoming United States election, and several mining pools moving large sums of BTC to exchanges.
Nevertheless, if the market continues to go down, Bitcoin’s price may drop to $10,200, and should this support fails to contain the sell-off, we may see a further drop to $10,000, $9,800, and critically $9,600. The resistance levels to watch are $11,700, $11,900, and $12,100 respectively. Meanwhile, the RSI (14) is crossing below 40-level, suggesting more bearish signals.
BTC/USD Medium – Term Trend: Bearish (4H Chart)
Looking at the 4-Hour chart, yesterday, we observed how BTC/USD was recovering along with the $11,400 and expected it would push sideways before another big move arrived. Until the early hours of today, where BTC has been hugging tightly along the prior support zone until another huge wave of selling pressure arrived and drove prices down to $11,200.

However, during the second leg of the crash, panic selling drives Bitcoin prices through the psychological $11,000, and down as far as the $10,560 level, before correcting. To begin a bullish movement, BTC/USD may need to push the market price towards the resistance level of $11,200 and above while the supports are located at $10,200 and below as the RSI (14) remains within the oversold region.
Join Our Telegram channel to stay up to date on breaking news coverage