Join Our Telegram channel to stay up to date on breaking news coverage
Bitcoin (BTC) Price Prediction – August 29
BTC/USD could be treated to a relatively smooth ride above towards $12,000 as long as the hurdle at $11,800 is overcome.
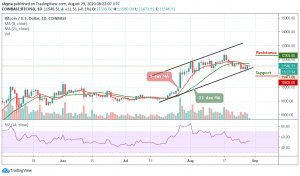
BTC/USD Long-term Trend: Ranging (Daily Chart)
Key levels:
Resistance Levels: $12,300, $12,500, $12,700
Support Levels: $10,800, $10,600, $10,400

BTC/USD started today’s trading with a short-term upside correction from the $11,477 level of support as it manages to climb to $11,500. The top crypto even managed to form a high near $11,580 before facing some resistance that resulted in a slight downtrend. At the time of writing this article, Bitcoin is trading at $11,456.
What Traders May Expect from Bitcoin (BTC) Today
The daily chart reveals that the Bitcoin bulls are now facing a major hurdle near $11,600, and a close above this crucial level is a must to increase the chances of a fresh uptick. A recovery above $11,600 could see the Bitcoin price attempt an upside break towards $11,800 in the near term.
On the contrary, if the world’s leading digital asset fails to continue higher above the $11,500, there could be another bearish reaction that may drive BTC back towards the $11,200 level of support. Any further bearish movement could lead to the critical supports at $10,800, $10,600, and $10,400 respectively.
A couple of days ago, Bitcoin (BTC) bottomed at $11,125 and resumed the recovery towards $11,500. Presently, BTC/USD is changing hands at $11,456, having gained nearly 0.1% on a day-to-day basis. While the critical resistance remains unbroken, the upside momentum may gain traction later during the day as the coin could move within a strong bullish trend to meet the potential resistance at $12,300, $12,500, and $12,700 as the RSI (14) moves around 52-level.
BTC/USD Medium – Term Trend: Bearish (4H Chart)
On the 4-hour chart, a retest of $11,500 gives the impression that the bulls are not yet done. The Bitcoin price rises to fill a significant gap as the bulls remained in control which may take the coin towards the $11,600.
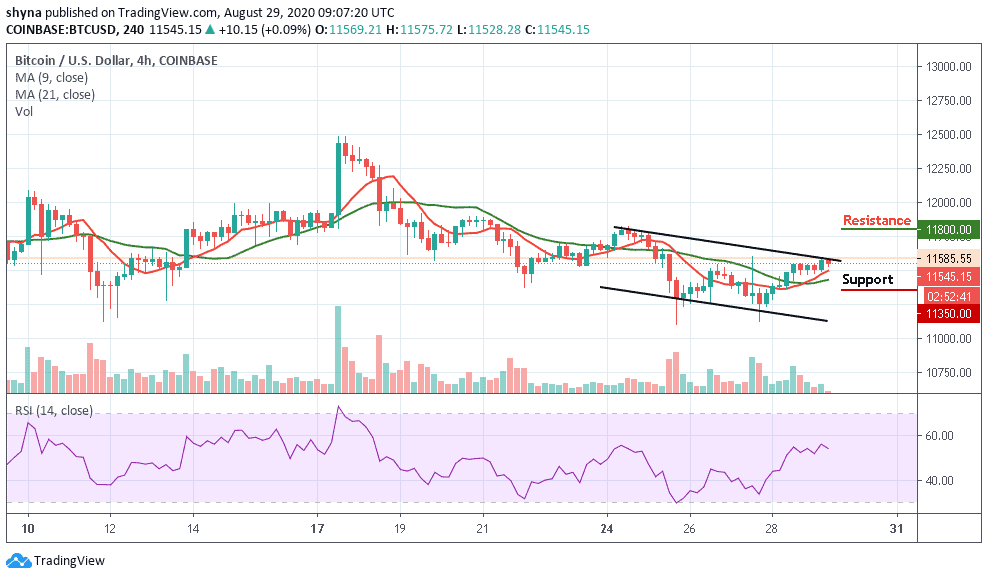
In a short time, BTC/USD may hit $11,800 and above if the bullish pressure continues. Otherwise, the price may plummet to $11,350 and below. The RSI (14) is seen nose-diving below 55-level which may send the market in a bearish scenario.
Join Our Telegram channel to stay up to date on breaking news coverage