Join Our Telegram channel to stay up to date on breaking news coverage
Bitcoin (BTC) Price Prediction – August 25
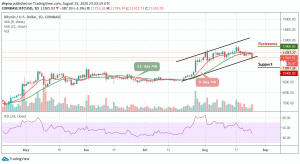
Bitcoin (BTC) declined more than $300 today. The coin is still facing a drop to $11,000 before a strong upward move in the coming days.
BTC/USD Long-term Trend: Ranging (Daily Chart)
Key levels:
Resistance Levels: $12,400, $12,600, $12,800
Support Levels: $10,400, $10,200, $10,000
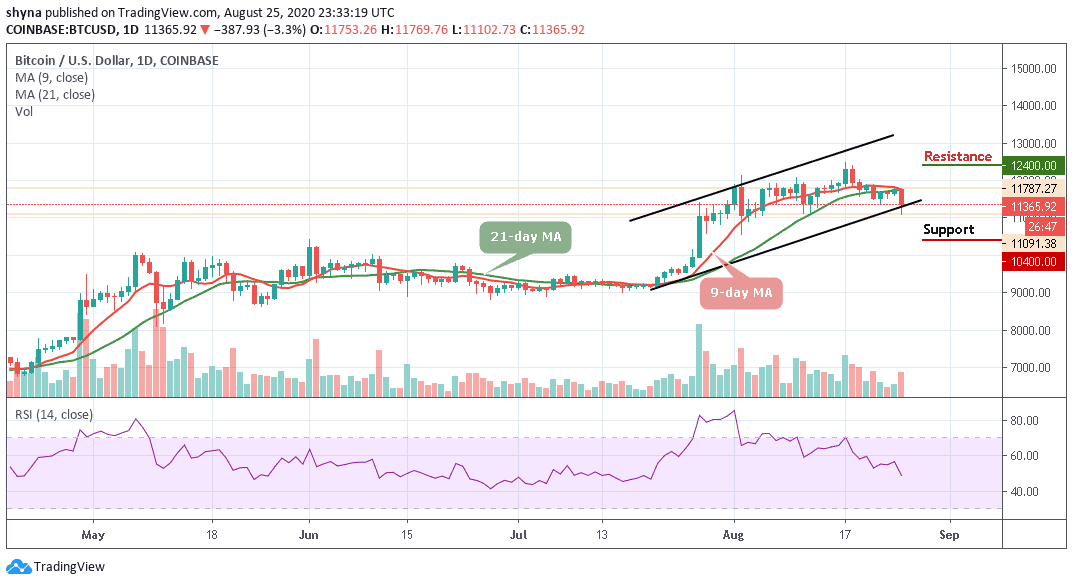
After forming a short term top some few days ago, BTC/USD price dives below the 9-day and 21-day moving averages. The Bitcoin price is currently consolidating around $11,365, with a bearish signal. However, the recent correction to the upward failed near the $11,500 level. It seems like Bitcoin bulls are struggling to gain momentum above the $11,400 level.
Will BTC Break Below $11,000 or Rebounds?
On the downside, the $11,000 and $10,800 levels are initial supports. If the bulls fail to defend the recent low of $11,091, there is a risk of a sharp decline. The next key supports on the downside are near the $10,700 and $10,500 levels, where the bulls are likely to take a strong stand. But if the bulls fail to take a strong stand within this level, then, BTC/USD may drop further to the critical supports of $10,400, $10,200, and $10,000 respectively.
Nevertheless, if there is a clear break above the 9-day moving average, the Bitcoin price could test the $12,000 resistance level. If the bulls manage to gain strength above this level, there are chances of a decent recovery towards the $12,000 resistance area. The key breakout zone is near the $12,400, $12,600, and $12,800 resistance levels. Meanwhile, the RSI (14) for BTC/USD is facing the bearish zone.
BTC/USD Medium – Term Trend: Bearish (4H Chart)
Against a 4-hour chart, the Bitcoin price has been surging within 24 hours, bringing its price from $11,774 to reach around $11,100. Should the price continue to drop further and move below the channel, it could reach the nearest supports at $10,900, $10,700, and 10,500.
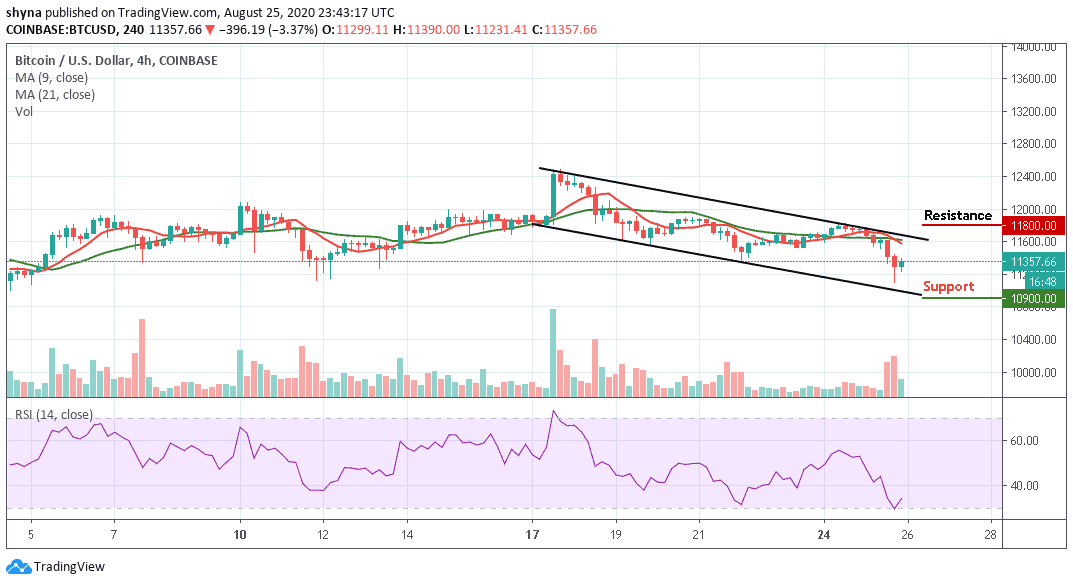
Moreover, if the bulls push the coin above the 9-day and 21-day moving averages, the price of Bitcoin may likely reach the potential resistance levels of $11,800, $11,600, and $11,400. At the moment, the market may be following an uptrend as the RSI (14) is moving from the 30-level.
Join Our Telegram channel to stay up to date on breaking news coverage