Join Our Telegram channel to stay up to date on breaking news coverage
Bitcoin (BTC) Price Prediction – October 29
Bitcoin is fluctuating in the $13,000 area and traders have so far been bearish as global markets remain deep for the past two days.
BTC/USD Long-term Trend: Bullish(Daily Chart)
Key levels:
Resistance Levels: $14,000, $14,200, $14,400
Support Levels: $12,300, $12,100, $11,900
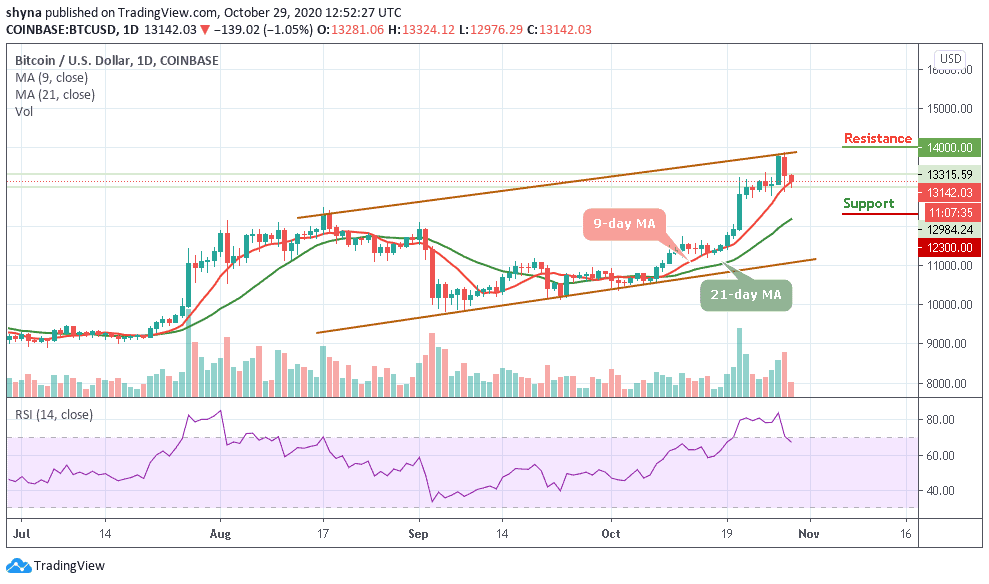
As most altcoins remain in the red, BTC/USD continues to fall. Within several hours, the cryptocurrency slid from $13,281 to around the $12,976 mark. The price is now fluctuating around $13,142. The Bitcoin price crashes below the immediate support as it breached a $13,000 price area. Taking a glance at the price movement now, we see that the coin had almost a flat movement with a few intermittent highs and lows over the past 48 hours.
Where is BTC Price Going Next?
According to the daily chart, BTC/USD is forming a bearish pennant pattern and when formed, signals a continuation of the former trend before the consolidation began. Meanwhile, the Bitcoin price is still under great risk of breakdown especially if the pattern support is shattered. Moreover, it could be catastrophic for BTC/USD if support at $12,700 gives in, which would encourage more selling, forcing BTC/USD down a painful path with a bearish target of $12,500.
However, BTC/USD is strongly supported at the former resistance level of $12,800. Nevertheless, the bulls are also banking on the support at $12,300, $12,100, and $11,900 to ensure that in spite of a reversal, the Bitcoin price stays above the $13,500 level. Similarly, the nearest resistance levels to watch are $14,000, $14,200, and $14,400 respectively. Meanwhile, the RSI (14) is moving out of the overbought zone.
BTC/USD Medium – Term Trend: Ranging (4H Chart)
On the 4-Hour chart, BTC price hovers around $13,319 and may take time to persistently trade above $13,500. More so, if the bulls gather enough strength and regroup again, the upward movement could reach the resistance level at $13,600 and above.
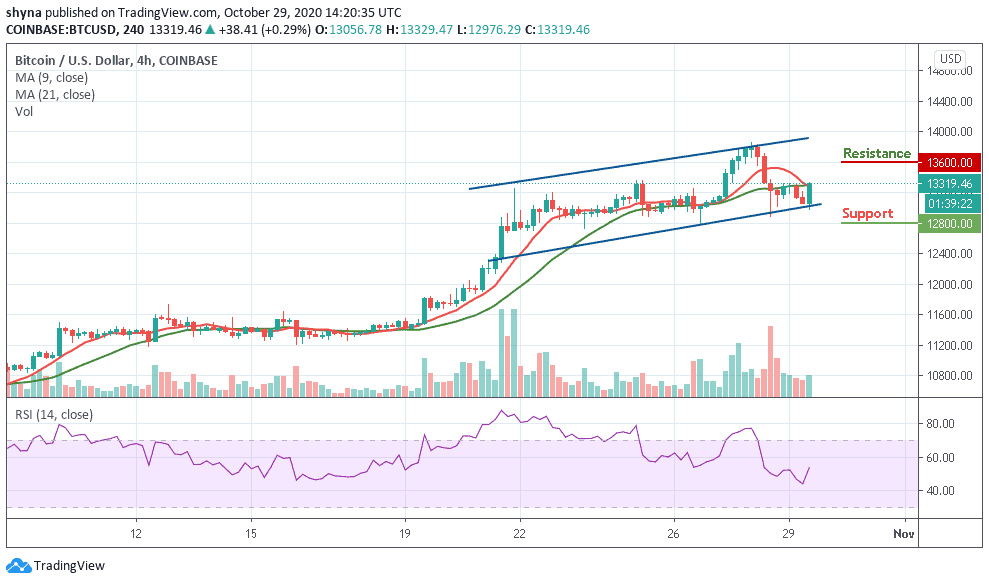
However, on the downside, immediate support is around the $13,100 level while the main support is at the $13,000 level. The price may likely fall below $12,900 if the bears step back into the market, a further movement could test the critical support at the $12,800 level. Technically, Bitcoin (BTC) may keep the upward trend tight if the 9-day MA remains above the 21-day MA as the RSI (14) faces the north.
Join Our Telegram channel to stay up to date on breaking news coverage