

Join Our Telegram channel to stay up to date on breaking news coverage
Bitcoin (BTC) Price Prediction – January 3
The Bitcoin bulls managed to push the pair above the $34,000 level as the first digital asset touches a new price record at $34,810.
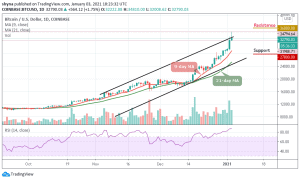
BTC/USD Long-term Trend: Bullish (Daily Chart)
Key levels:
Resistance Levels: $36,000, $36,200, $36,400
Support Levels: $27,800, $27,600, $27,400

At the time of writing, BTC/USD is trading around $32,790 above the 9-day and 21-day moving averages. Despite the retracement, Bitcoin (BTC) has remained in a bullish zone and it is likely to continue higher towards $35,000 and $36,000. However, the strong increase in BTC/USD price didn’t stop there as it soared to a new all-time high above $34,800 before correcting lower. The king coin is now plunging below the $33,000 resistance level which may cause many investors to take profits off the table.
What to Expect from Bitcoin (BTC)
The daily chart reveals that the Bitcoin bulls are now dominating the market. However, if the bulls continue to push the market above the recent daily high, then the market price could hit the resistance levels of $36,000, $36,200, and $36,400 respectively. Moreover, further bullish movement above these resistance levels may encourage further buying above the upper boundary of the channel.
In other words, a break below the 9-day moving average may provoke an even deeper decline towards the $27,800, $27,600, and $27,400 support levels. Meanwhile, according to the technical indicator RSI (14), Bitcoin may continue to follow an upward trend as the signal line moves above the 85-level within the overbought zone.
BTC/USD Medium-term Trend: Bullish (4H Chart)
Looking at the hourly chart, following the rejection of $34,800, BTC/USD is trading below the $33,000 resistance level. Looking at it from above, if the Bitcoin holds above $34,000, then the next level of resistance could be $34,500 before the 2021 high at $34,810, along with the significant mentioned ascending trend-line. The next resistance would be $35,400, followed by $35,600 and $35,800.
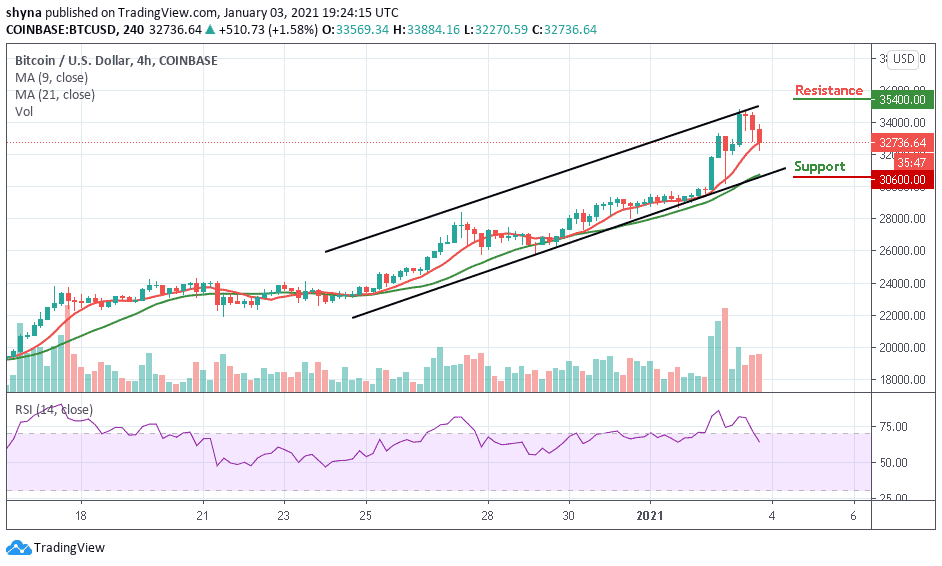
Meanwhile, as the technical indicator moves below the 65-level, this might have signaled a temporary end to the bullish trend of Bitcoin. However, the RSI (14) indicator is encountering the crucial higher lows trend-line. If it fails to find support here, then traders can expect the correction to get even deeper, which may likely reach the support levels of $30,600, $30,400, and $30,200 respectively.
Join Our Telegram channel to stay up to date on breaking news coverage
