Join Our Telegram channel to stay up to date on breaking news coverage
Bitcoin (BTC) Price Prediction – December 6
The Bitcoin (BTC) is recovering from the recent low on approach to $18,800 but bulls may have trouble taking the market price above $19,500.
BTC/USD Long-term Trend: Bullish (Daily Chart)
Key levels:
Resistance Levels: $20,800, $21,000, $21,200
Support Levels: $17,800, $17,600, $17,400
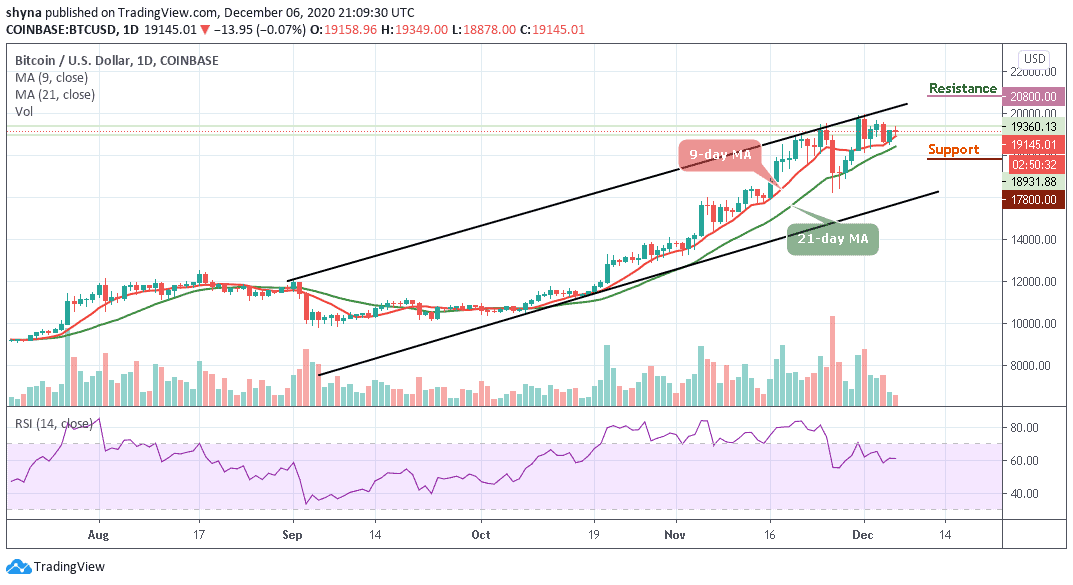
After touching the daily low at $19,878, BTC/USD resumes the upside trend during early Asian hours. At the time of writing, the first digital asset is changing hands at $19,145 and the upside momentum is gaining traction. However, a sustainable move above $19,500 will bring $19,900 back into focus and improve the technical picture.
What to Expect from BTC?
According to the daily chart, BTC/USD is moving above the 9-day and 21-day moving averages. This barrier creates the first line of support that may slow down the correction. However, BTC/USD may retest $18,500 before another attempt at $18,300 but if $18,800 is broken, a further low drive could send the price to $17,800, $17,600, and $17,400 supports
Moreover, if the coin continues to hovers above the moving averages, traders may see a bull-run to $20,500 vital resistance. Presently, bulls are dominating the market and the Bitcoin price may continue to follow the upward trend in as much as the red-line of 9-day MA is above the green-line of 21-day MA and the potential resistance levels are located at $20,800, $21,000, and $21,200 while the technical indicator keeps moving above the 60-level.
BTC/USD Medium-Term Trend: Ranging (4H Chart)
On the 4-Hour chart, BTC price hovers around $19,189 and may take time to persistently trade above $19,500. More so, if the bulls gather enough strength and regroup, the upward movement may be able to near the $19,800 and $20,000 resistance level.
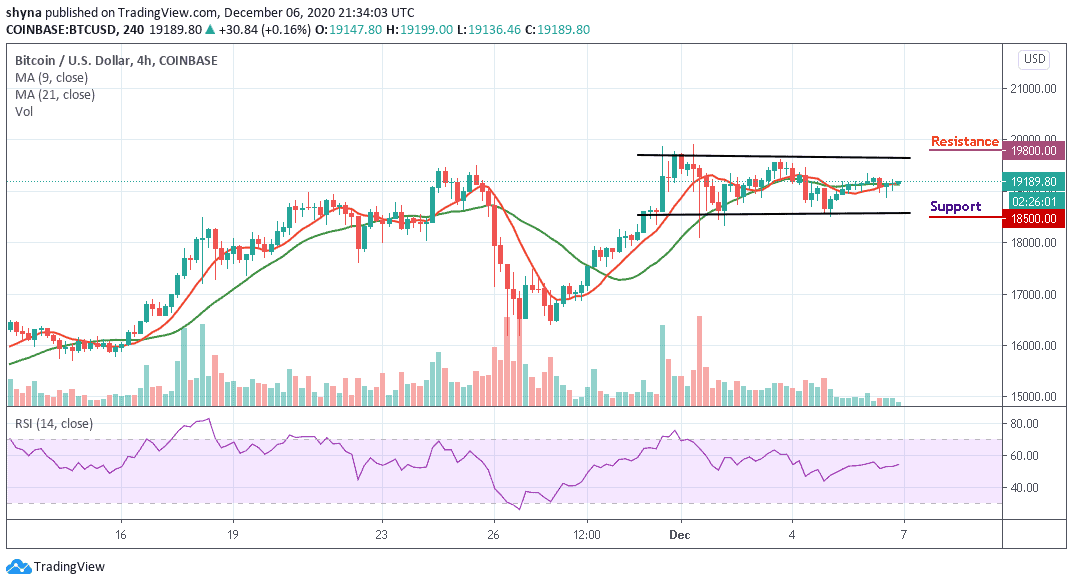
However, on the downside, immediate support is around the $18,800 level while the main support is at the $18,600 level. The price may likely fall below $18,500 if the bears step back into the market, a further movement could test the critical support at the $18,300 level. Technically, Bitcoin is currently moving in sideways while the RSI (14) moves above the 50-level, indicating an indecisive in the market movement.
Join Our Telegram channel to stay up to date on breaking news coverage