Join Our Telegram channel to stay up to date on breaking news coverage
Bitcoin (BTC) Price Prediction – November 27
Today, the Bitcoin price loses traction after opening at $17,155; losses likely to continue in the near term.
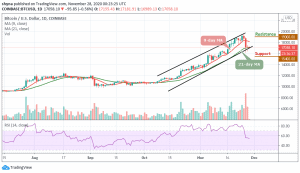
BTC/USD Long-term Trend: Bullish (Daily Chart)
Key levels:
Resistance Levels: $19,000, $19,200, $19,400
Support Levels: $15,400, $15,200, $15,000

Looking at the daily chart, one can easily conclude that BTC/USD may be heading back to the red zone as the coin is posting minor losses of 0.56% on the day after commencing the trading at $17,155. More so, the coin has an intraday high of $17,181; although the world’s largest crypto touches the support level of $16,989 before going back to where it is currently trading at $17,058.
Would Bitcoin Price Go Down Or Up?
The Bitcoin price is seen plunging below $17,000 one more time, marking $16,989 as the current daily low at the moment. Does this mean that Bitcoin (BTC) is finally leaving the significant $17,000 level and searching for a new low? However, looking at the declining daily volume candle, together with the steady but stable recent Bitcoin price action, it can be assumed that the market may soon experience a stronger bearish movement.
At the time of writing, BTC/USD is struggling to maintain the $17,100 level and if the coin follows the downward trend as the RSI (14) moves below the 55-level, the next supports may likely come at $15,400, $15,200, and $15,000. From the upside, by maintaining the current level of $17,085, any bullish movement may likely cross above the 9-day and 21-day moving averages to send the price to the resistance levels of $19,000, $19,200, and $19,400 respectively.
BTC/USD Medium-Term Trend: Bearish (4H Chart)
On the 4-Hour chart, BTC price hovers below the 21-day moving average around $17,084 which may take time to persistently trade above $17,100. However, if the bulls regroup and gather enough strength, the upward movement may be able to reach the $18,200 and $18,400 resistance levels.
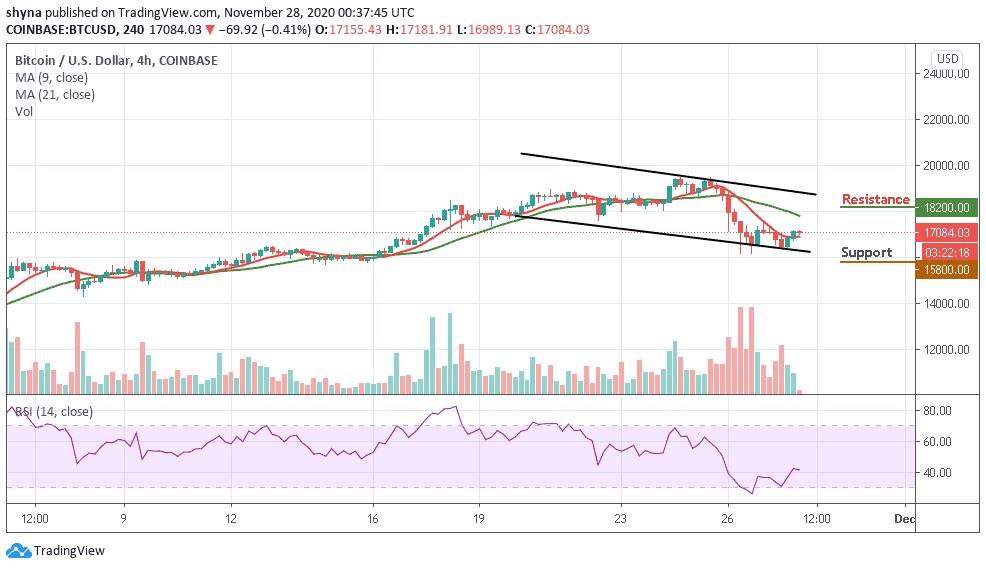
On the downside, the immediate support is around the $16,500 level while the main support is at the $16,000 level. Therefore, crossing below the lower boundary of the channel may cause the coin to hit the supports at $15,800 and below. Technically, BTC/USD may be moving sideways as the RSI (14) moves above the 40-level.
Join Our Telegram channel to stay up to date on breaking news coverage