Join Our Telegram channel to stay up to date on breaking news coverage
Bitcoin (BTC) Price Prediction – August 25
Bitcoin (BTC) now focuses on downtrends, is the short-term crypto market uptrend over?
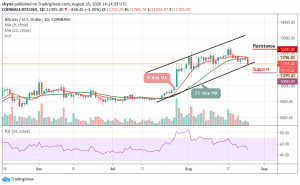
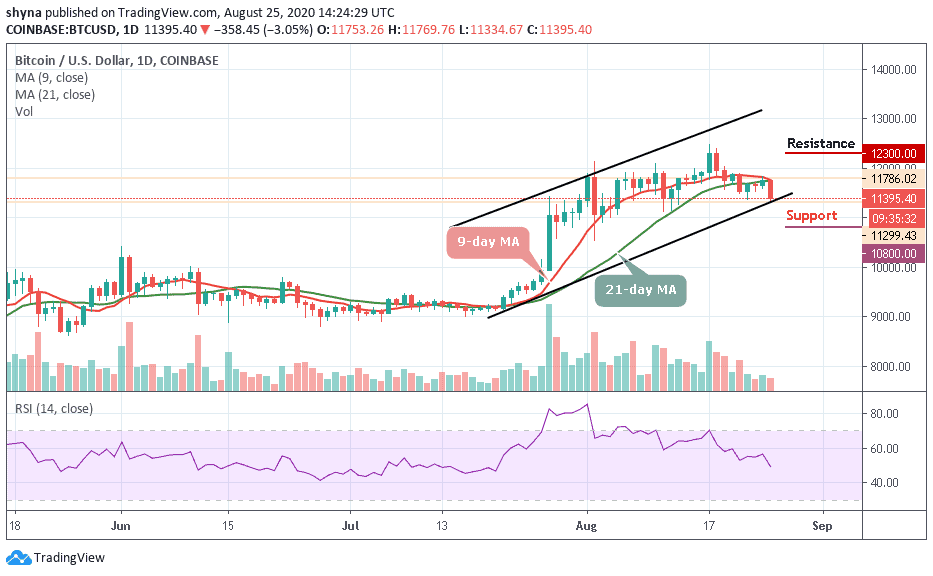
BTC/USD Long-term Trend: Bullish (Daily Chart)
Key levels:
Resistance Levels: $12,300, $12,500, $12,700
Support Levels: $10,800, $10,600, $10,400
BTC/USD falls below $11,500, prompting widespread crypto market profit-taking. The number-one crypto just broke below $11,500 briefly, dragging the rest of the crypto market down with it. Is the crypto market heading towards another bull run, and this is just another healthy and needed correction along the way to new highs? Or is this a major rejection back into the troughs of the bear market?
What to Expect from Bitcoin (BTC)
On the downside, the local support is created by $11,300. Once it gives way, August 12 low at $11,126 will come into focus. This barrier reinforced by the lower line of the channel should slow down the sellers and trigger the recovery. If BTC/USD struggles to climb above the 9-day and 21-day moving averages, there could be more bearish reactions.
Similarly, initial support is near the $11,200 level below the channel lower trend line. If there is another downside break below this support, the market price could even decline below the $10,800, $10,600, and $10,400 support levels as the technical indicator RSI (14) nosedives below 50-level. From the above, for a bullish continuation, BTC/USD needs to break above the moving averages to hit the resistance levels at $12,300, $12,500, and $12,700
BTC/USD Medium-Term Trend: Bearish (4H Chart)
Looking at the 4-hour price chart, we can see that the bearish supply is becoming heavy in the market and the bulls are also trying to defend the $11,300 supports. Meanwhile, the $11,100 support level and below may come into play if BTC breaks the mentioned support.
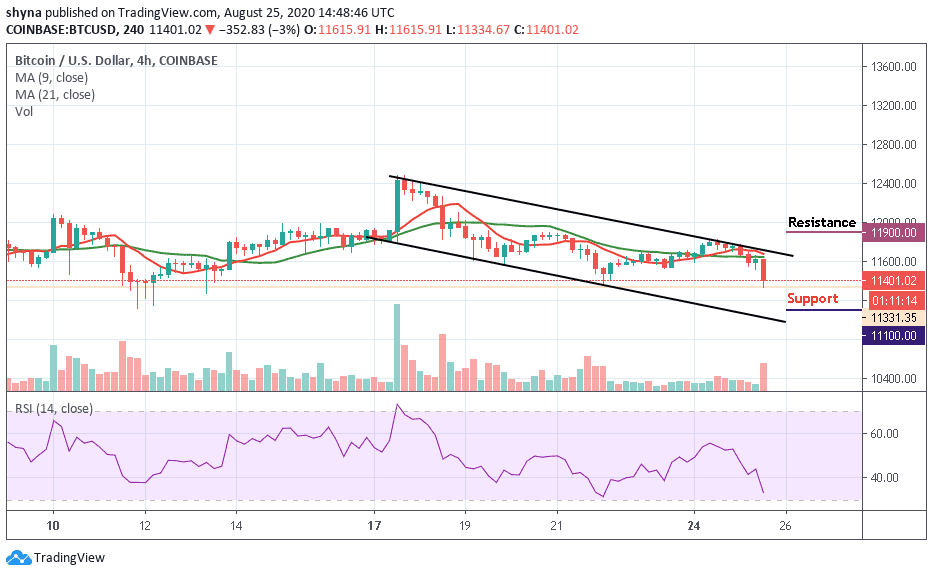
However, if the Bitcoin bulls can repower the market, traders can expect a retest of $11,600 resistance level. Therefore, breaking the mentioned resistance could also allow the bulls to test the $11,900 and above. However, the technical indicator RSI (14) signal line free-falls to 33.42-level, suggesting bearish signals.
Join Our Telegram channel to stay up to date on breaking news coverage