Join Our Telegram channel to stay up to date on breaking news coverage
Bitcoin (BTC) Price Prediction – August 24
BTC/USD bulls are struggling to push the price towards a potential $12,000 resistance level.
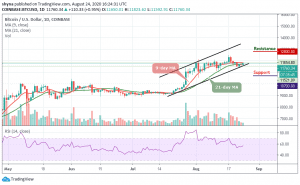
BTC/USD Long-term Trend: Bullish (Daily Chart)
Key levels:
Resistance Levels: $12,800, $13,000, $13,100
Support Levels: $10,700, $10,500, $10,300

BTC/USD continuously failed to sustain the $12,000 price level with recent corrections falling below $11,500 in the last few days. However, the price is currently up 0.95% and trading sideways in a tight range a little above the $11,700 area around the 9-day and 21-day moving averages as the RSI (14) is facing the 60-level. More so, a retracement below $11,300 could see Bitcoin (BTC) crash to $11,000.
What is Next for Bitcoin (BTC)
The $11,600 support level is critical to Bitcoin’s next price movement. Therefore, for BTC/USD to test $12,000 again, buyers may need to be strong enough to force it through the nearest resistance of $11,800 and it may likely push the price to $12,800, $13,000, and $13,200 resistance levels, failure to which the price might plummet sharply to lower support levels.
Below the $11,000 mark, the lower support zone may be located at $10,700, $10,500, and $10,300 levels, although traders do not see Bitcoin retracing so further back.
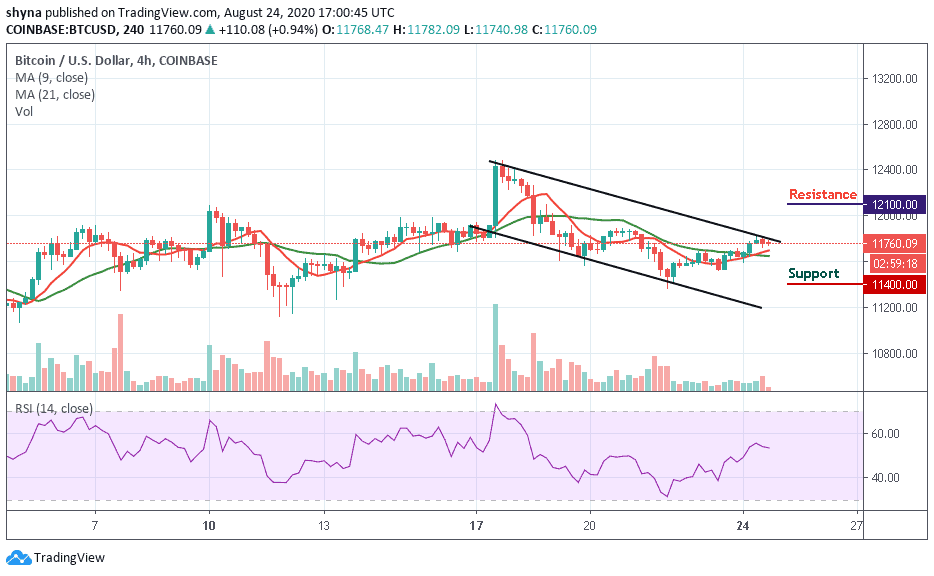
BTC/USD Medium-Term Trend: Bearish (4H Chart)
According to the 4-hour chart, for almost a week, BTC/USD is trading in a range between $11,400 and $11,800. Presently, as BTC trades around $11,700, it will have to break above $11,900 and then challenge $12,000 in order to get back to the higher lows bullish trajectory (short-term). From above, the potential resistance lies at $12,100 and above while the supports could be found at $11,400 and below. The RSI (14) is seen moving below 55-level.
Bitcoin’s Next Bull Run May Be Epic
The government budget plans will continue to pump more money into the economy, which is bad for the US dollar, but good for the market valuation of Bitcoin, depending on how much will be used to acquire Bitcoin.
According to professional analyst Max Kaiser, recent developments in the traditional market, such as Warren Buffett’s abandonment of stocks for gold, indicate a massive bullish movement in Bitcoin prices. If 1% of the global allocation ($1 trillion) goes to Bitcoin, its price may reach $50,000.
Join Our Telegram channel to stay up to date on breaking news coverage