

Join Our Telegram channel to stay up to date on breaking news coverage
Bitcoin (BTC) Price Prediction – October 12
The Bitcoin (BTC) is showing a pullback that may be affecting the majority of altcoins within the market.
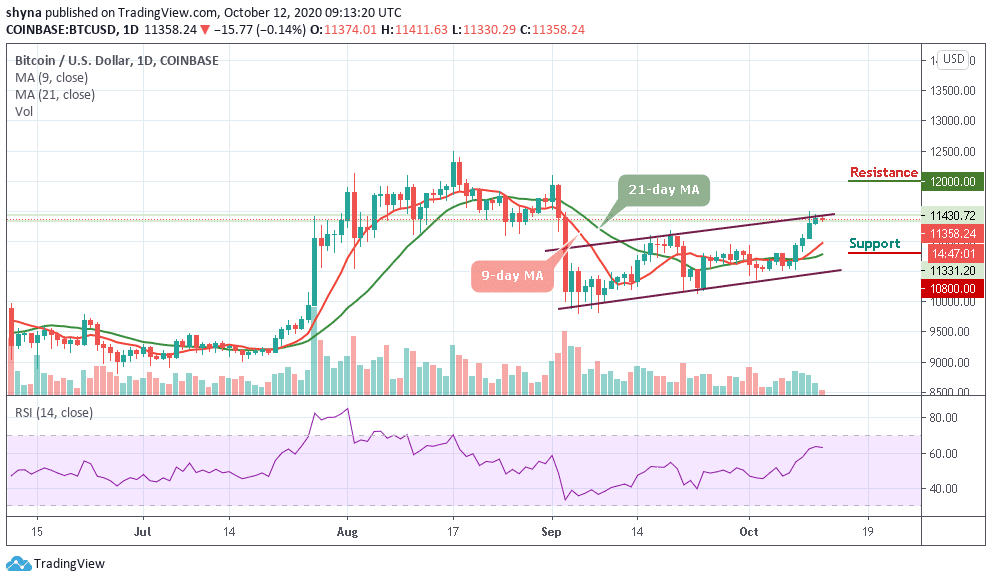
BTC/USD Long-term Trend: Bullish (Daily Chart)
Key levels:
Resistance Levels: $12,000, $12,200, $12,400
Support Levels: $10,800, $10,600, $10,400

BTC/USD is putting the traders under a nail-biting situation today as the coin is seen pulling back after touching the $11,411 resistance level. However, from its pulled-back, the coin was above $11,400 when the day opened, and the price correction drove the coin below $11,380. Such price decline has triggered doubts amongst the crypto community as the decline is also affecting both the XRP and ETH.
Where is BTC Price Going Next?
The coin is trading at $10,358.24 with an intraday loss of 0.14%. The prevailing trend is bearish with expanding volatility. The first digital asset is currently consolidating in a bullish flag pattern. Meanwhile, a breakout out from this pattern is supposed to continue in the direction of the previous trend. In this case, we expect BTC/USD to rise above $11,700 resistance and could move towards the potential resistance levels at $12,000, $12,200, and $12,400.
However, should Bitcoin price failed to remain above the 9-day and 21-day moving averages; the price could drop to $10,900 vital support. A further low drive could send the price to $10,800, $10,600, and $10,400 support levels. The technical indicator RSI (14) is revealing a sign of trend reversal, which shows a possible more bearish momentum may continue to play out.
BTC/USD Medium – Term Trend: Ranging (4H Chart)
At the opening of the market today, the Bitcoin price first went up but has dropped slightly within 24 hours, bringing its price from $11,374 to reach around $11,410. Should the price continue to drop further and move below the 9-day and 21-day moving averages, it could reach the nearest support levels at $11,100 and below.
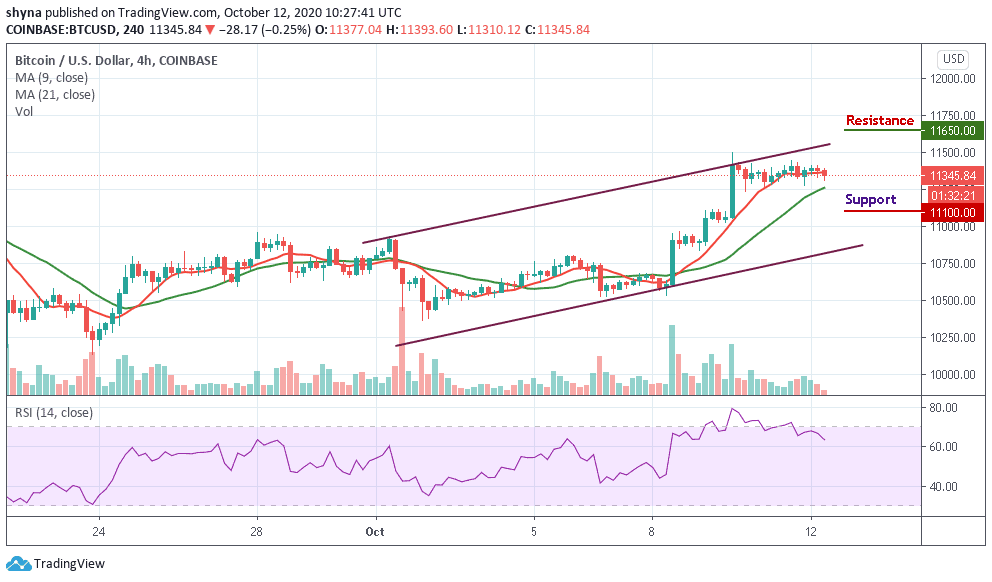
Moreover, if the bulls push the coin above the upper boundary of the channel, the Bitcoin price may likely reach the potential resistance levels of $11,650and above. Presently, the market may either move sideways or experience downtrends as the RSI (14) indicator moves to cross below the 60-level.
Join Our Telegram channel to stay up to date on breaking news coverage
