Join Our Telegram channel to stay up to date on breaking news coverage
Bitcoin (BTC) Price Prediction – March 31
Bitcoin is currently trading above the moving averages after touching the low of $56,873.
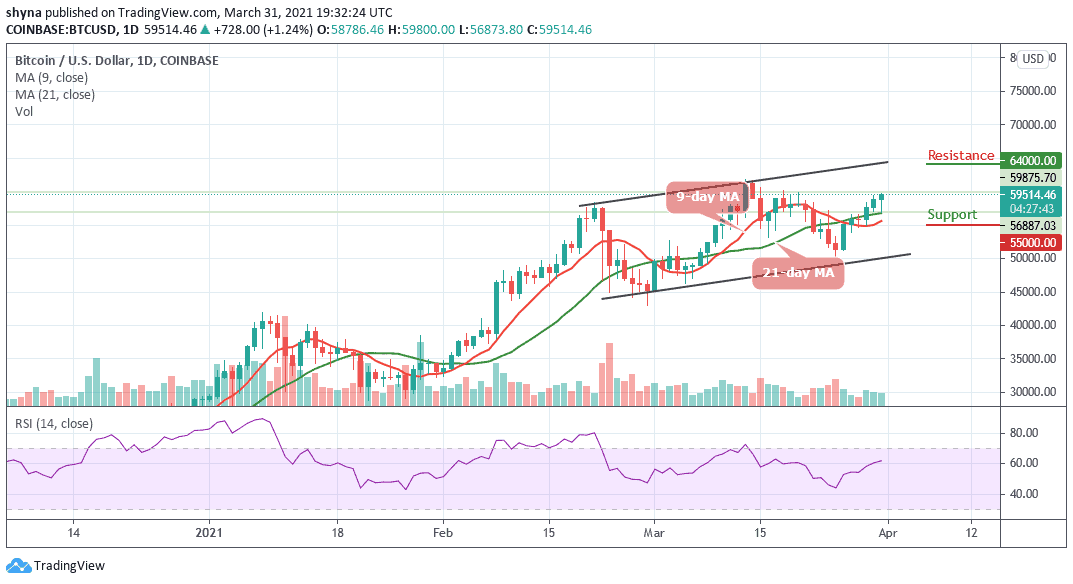
BTC/USD Long-term Trend: Bullish (Daily Chart)
Key levels:
Resistance Levels: $64,000, $66,000, $68,000
Support Levels: $55,000, $53,000, $51,000
BTC/USD bulls are back in action after staying under solid pressure in the early hours of today. However, Bitcoin’s (BTC) price is up 1.24% as of writing this and is currently hovering above the $59,000 level.
Where is BTC Price Going Next?
At the time of writing, BTC/USD is trading at $59,514 with a gain of 1.24% on the day. The trading is hovering above the 9-day and 21-day moving averages as the technical indicator RSI (14) moves above the 60-level. It is important that the bulls reclaim this barrier as this would allow them to focus on higher levels towards $60,000. On the other side, any declines below the moving averages could easily open the way to the south.
Meanwhile, the breakdown towards $54,000 is not out of the picture because the losses in the last few days show that BTC/USD may not be technically ready for the breakout above $62,000. Looking at the daily chart, BTC/USD is making an attempt to regain ground by moving the market price to the next level. Moreover, any bullish movement towards the upper boundary of the channel may push the price to the resistance levels of $64,000, $66,000, and $68,000 while the supports are located at $55,000, $53,000, and $51,000 respectively.
BTC/USD Medium – Term Trend: Bullish (4H Chart)
Looking at the 4-hour chart, the Bitcoin price crosses above the 9-day and 21-day moving averages within 24 hours. If the price continues to rise further and move above the upper boundary of the channel, it could reach the nearest resistance levels at $61,000 and above.
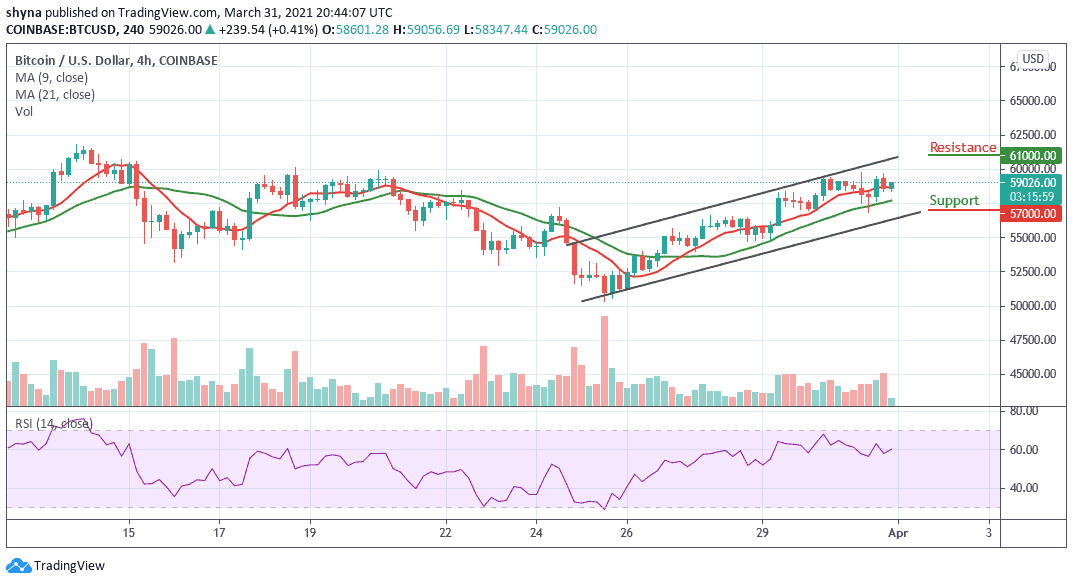
Moreover, if the bears push the coin below the moving averages, the price of Bitcoin may likely reach the closest supports at $57,000 and below. Presently, the technical indicator RSI (14) is seen moving below the 60-level, crossing above it may confirm the bullish trend for the market.
Join Our Telegram channel to stay up to date on breaking news coverage