Join Our Telegram channel to stay up to date on breaking news coverage
Bitcoin Price Prediction (BTC) – March 23
The Bitcoin price remains below the moving averages, trading at $53,366 support.
BTC/USD Long-term Trend: Bullish (Daily Chart)
Key levels:
Resistance Levels: $60,000, $62,000 $64,000
Support Levels: $48,000, $46,000, $44,000
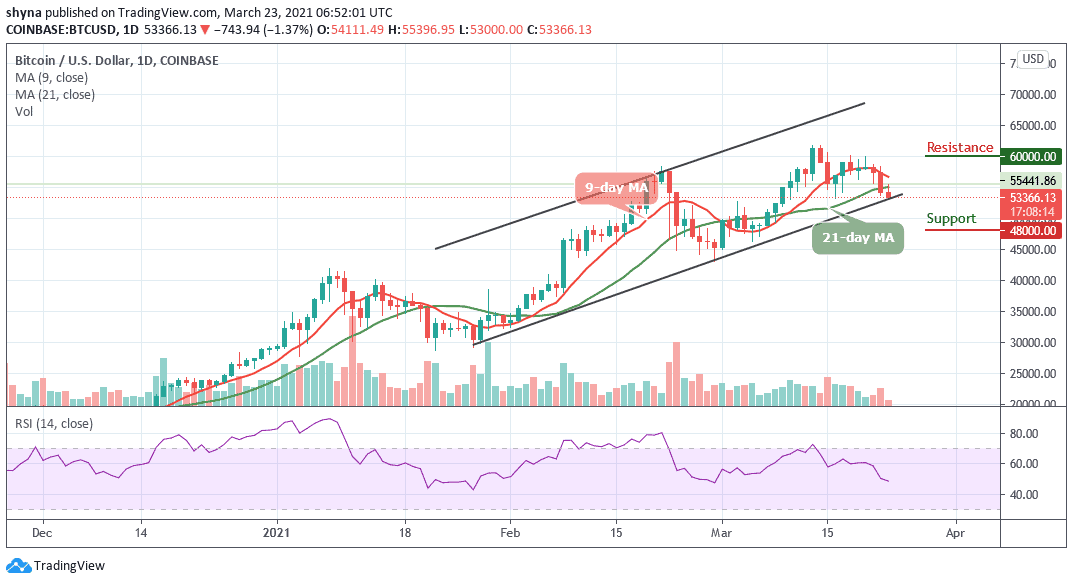
BTC/USD is currently facing a setback as this might not be a permanent one. The coin is likely to have a bullish run in the short-term but a price rally may help the coin to touch its daily high. Currently, Bitcoin is trading around $53,366 level after a free fall from $55,396 a few hours back and the coin has shown tremendous volatility over the past few days.
What is the Next Direction for Bitcoin?
Looking at the daily chart, for the coin to touch the low of $53,000 today, if the price should slump below this support level, the $50,000 mark could be an important zone to keep an eye on. Therefore, crossing below the lower boundary of the channel could hit the supports at $48,000, $46,000, and $44,000, making room for BTC to fall even further.
On the other hand, the technical indicator RSI (14) for the coin is hovering around the 50-level as trading volume is fading out. If the king coin decides to move the price above the moving averages, BTC/USD may see resistance levels at $60,000, $62,000, and $64,000. Nevertheless, Bitcoin is still expected to bounce back above $55,000 in order to complete the second part of its correction.
BTC/USD Medium-term Trend: Bearish (4H Chart)
A few weeks ago, Bitcoin’s price surges upward catapulting its price to touch the high of over $58,000. After this sudden rise, the coin started dropping in price to where it’s trading currently at $55,481. Therefore, should the market price drops further; it could reach the nearest supports at $53,000, $51,000, and $49,000 respectively.
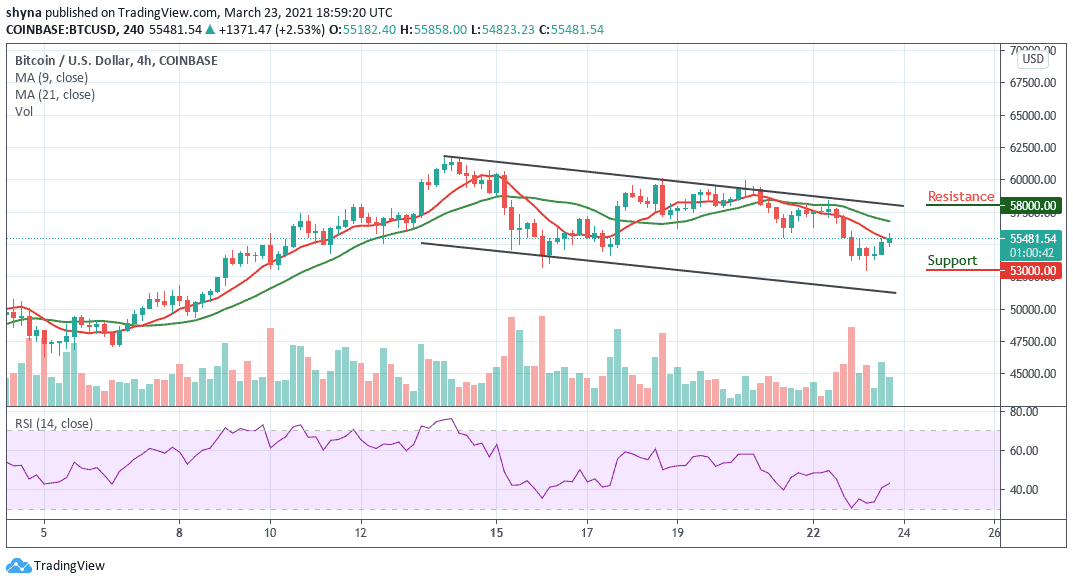
Moreover, if the bulls push the coin above the moving averages, the price of Bitcoin could hit the resistance at $56,000 before heading to the potential resistance levels of $58,000, $60,000, and $62,000. More so, the market is likely to follow a bullish trend as the RSI (14) indicator moves to cross above 40-level.
Join Our Telegram channel to stay up to date on breaking news coverage