Join Our Telegram channel to stay up to date on breaking news coverage
Bitcoin (BTC) Price Prediction – September 19
The Bitcoin price hits the major resistance level at $11,172 instead of just battling with supports.
BTC/USD Long-term Trend: Bullish (Daily Chart)
Key levels:
Resistance Levels: $11,700, $11,900, $12,100
Support Levels: $10,400, $10,200, $10,000

BTC/USD touches the price area around $11,172 after almost a weeklong of trading below the $11,000. Since the coin is currently correcting upwards, traders believe that BTC/USD is likely to cross many resistances instead of just battling inactive supports. At the moment, the Bitcoin price is seen trading at $11,058 after closing at $10,945 yesterday.
What is the Next Direction for Bitcoin?
The daily reveals that the coin is pulling back from the daily high of 11, 172 to where it is currently trading but may continue to head upward if the bulls put all the pressure into the market. Looking at the daily chart, BTC/USD is now trading above the 9-day and 21-day moving averages, breaking below this barrier may function as the support zones in the nearest term.
Meanwhile, on the upside, as the coin moves towards the 9-day and 21-day moving averages, little is in place to prevent correction targeting the key resistance of $9,000 as the technical indicator RSI (14) moves above the 42-level.
Meanwhile, the bulls are banking on the support levels of $10,400, $10,200, and $9,800 to ensure that in spite of a reversal, the Bitcoin price stays above the $10,800 level. Similarly, the nearest resistance levels to watch for are $11,700, $11,900, and $12,100 as the technical indicator RSI (14) moves above 50-level, aiding the bullish movement.
BTC/USD Medium – Term Trend: Bullish (4H Chart)
The 4-hour chart for BTC is still looking bullish as the market continues to show a sign of bullish trend since the daily opening. However, the Bitcoin price is still trading above the 9-day and 21-day moving averages; following the recent rebound at $10,899 which is now a key support level. The next key support levels are $10,800, $10,600, and $10,400.
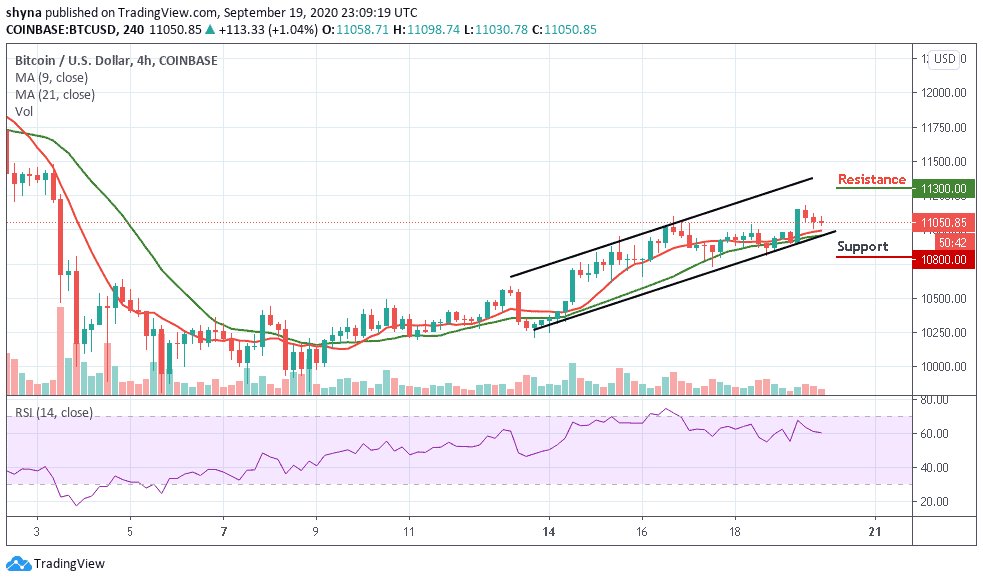
However, considering the recent sharp rebound, the Bitcoin price may continue the bullish rally to $11,200 resistance. A climb above the mentioned resistance may further push BTC price to $11,300, $11,500, and $11,700 resistance levels. As it appeared now, it seems the bears may likely return into the market as the RSI (14) is now revealed to cross below the 60-level.
Join Our Telegram channel to stay up to date on breaking news coverage