Join Our Telegram channel to stay up to date on breaking news coverage
Bitcoin (BTC) Price Prediction – February 23
Since yesterday, Bitcoin (BTC) tried to break above the $50,000 mark but with no success.
BTC/USD Long-term Trend: Bullish (Daily Chart)
Key levels:
Resistance Levels: $58,000, $60,000, $62,000
Support Levels: $40,000, $38,000, $36,000
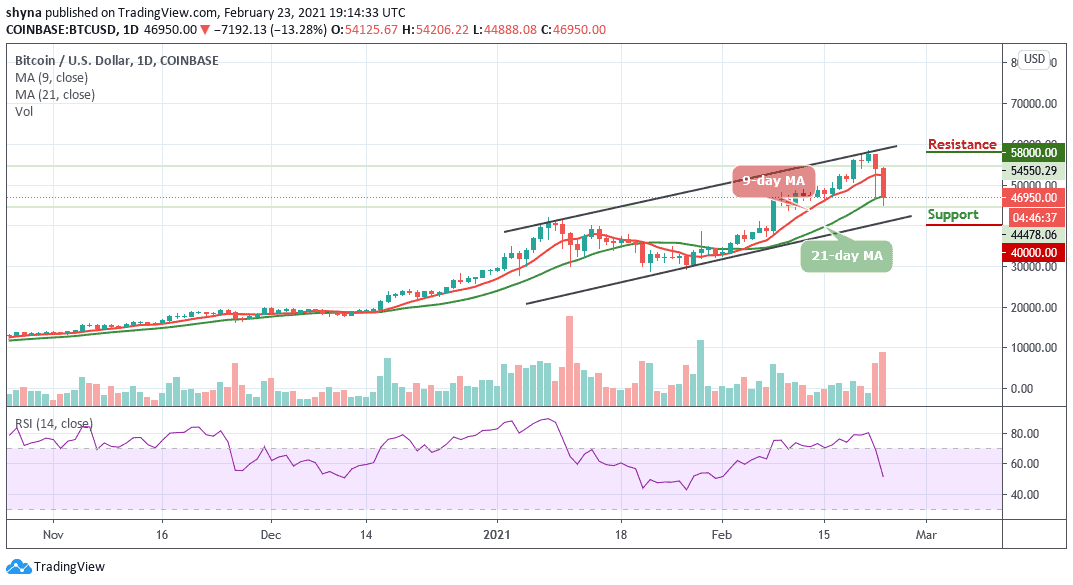
BTC/USD is pulling a shocking and devastating move against bullish investors following a tremendous fall from $54,000 to touch the low of today at $44,888. At the time of writing, BTC/USD is trading 13.28% lower on the day and hovers at $46,950. However, the bulls fail to breach the $54,125 psychological level which happens to be one of the reasons why the coin is facing a downward trend.
What to Expect from Bitcoin
The coin is trading at $46,950 displaying an intraday loss of 13.28%. The prevailing trend is bearish with expanding volatility. Therefore, a break below the lower boundary of the channel may likely continue in the direction of the downtrend. In this case, BTC/USD could fall below $42,000 support and further movement may hit the critical supports at $40,000, $38,000, and $36,000.
However, if the bulls can hold the price to remain within the 9-day and 21-day moving averages, moving up could push the price above the upper boundary of the channel and move to $58,000 vital resistance. A further high drive could send the coin to $60,000, and $62,000 resistance levels. Unfortunately, the technical indicator RSI (14) is revealing a sign of trend reversal, which shows a possible bearish momentum in the market.
BTC/USD Medium – Term Trend: Ranging (4H Chart)
According to the 4-hour chart, BTC/USD is trading within the range of $58,212 to $45,175. At the beginning of today’s trading at $45,464 which is now a key support level. Meanwhile, the next key support levels are located at $40,000, $38,000, and $36,000.
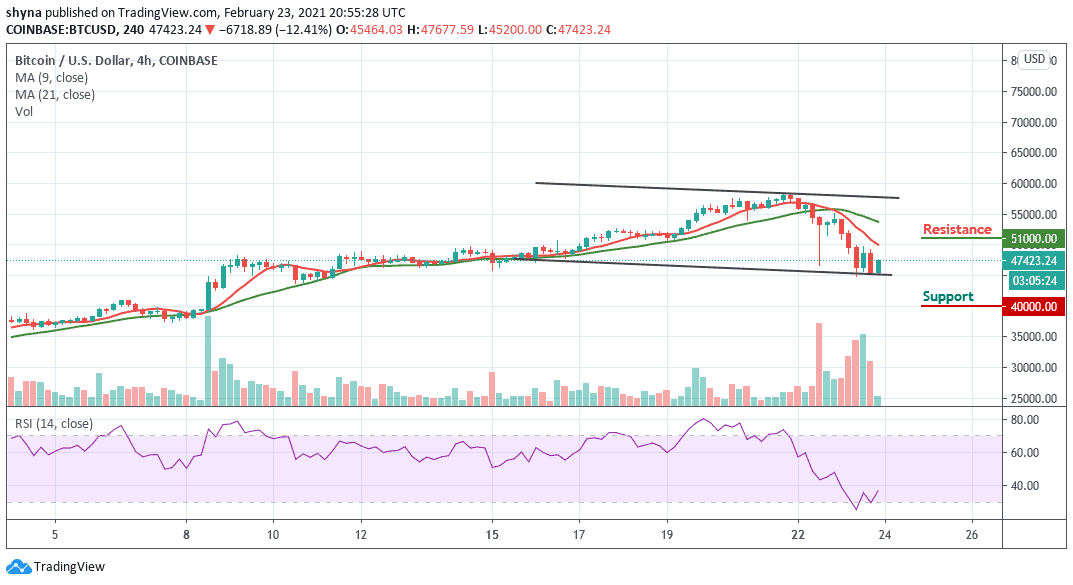
However, in as much as the buyers continue to reinforce and power the market more, traders can expect a retest at the $50,555 resistance level, and breaking this level may further push the price towards the resistance level of $51,000 and above. Similarly, the RSI (14) moves to cross above the 40-level, bullish movement may come to focus.
Join Our Telegram channel to stay up to date on breaking news coverage