Join Our Telegram channel to stay up to date on breaking news coverage
Bitcoin (BTC) Price Prediction – February 13
The Bitcoin (BTC) has been facing slight selling pressure as of late, with the resistance found within the $47,000 level.
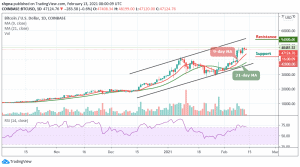
BTC/USD Long-term Trend: Bullish (Daily Chart)
Key levels:
Resistance Levels: $54,000, $56,000, $58,000
Support Levels: $42,000, $40,000, $38,000
BTC/USD has been struggling to maintain its uptrend, with the selling pressure found within the $47,000 region which is stopping it from seeing any major gains since yesterday. Meanwhile, traders are not surprised by the selling pressure as bears are trying to defend against a break above the cryptocurrency’s all-time highs. However, until bulls break above this level, the king coin may likely face a prolonged sideways movement.
What is the Next Direction for Bitcoin?
At the time of writing, BTC/USD is trading down just under 0.6% at its current price of $47,124. This marks a serious climb from its daily low of $47,120 set at the bottom of the decline. However, the coming few days may likely shine a light on Bitcoin’s outlook, as it is currently trading at a pivotal point. Therefore, any decline or rise from this level could determine its next trend.
BTC/USD is currently trading above the 9-day and 21-day moving averages, with bears moving the market price towards the south. Furthermore, any bearish movement below the 9-day moving average may push the price to the support level of $42,000, $40,000, and $38,000 while the resistance levels are located at $54,000, $56,000, and $58,000 as the technical indicator remains within the overbought region.
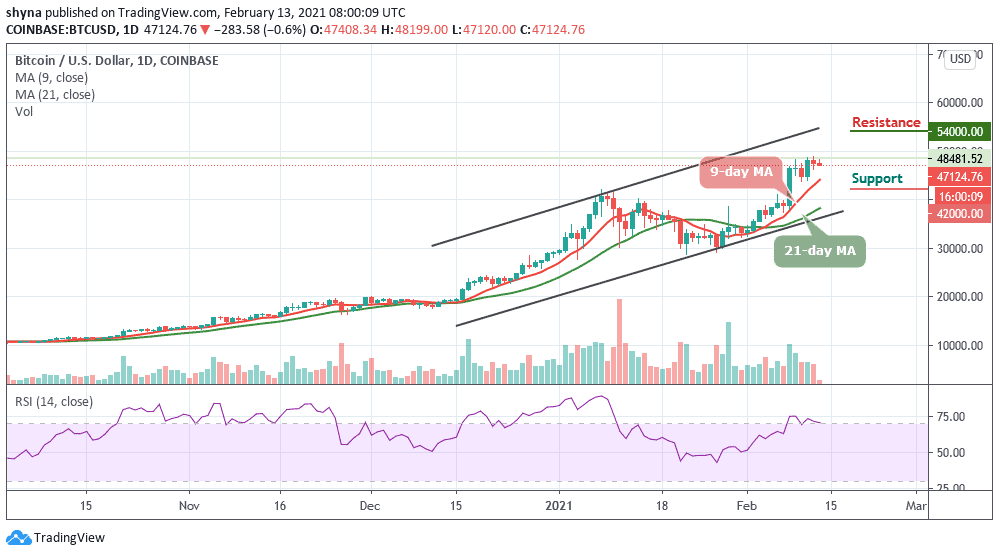
BTC/USD Medium – Term Trend: Ranging (4H Chart)
Looking at the 4-hour chart, the resistance at the $48,000 has been too heavy for the bulls to overcome as the price is now struggling in a consolidation mode, which has made the cryptocurrency remain indecisive over the past few hours now. The resistance levels to watch are 50,500 and above.
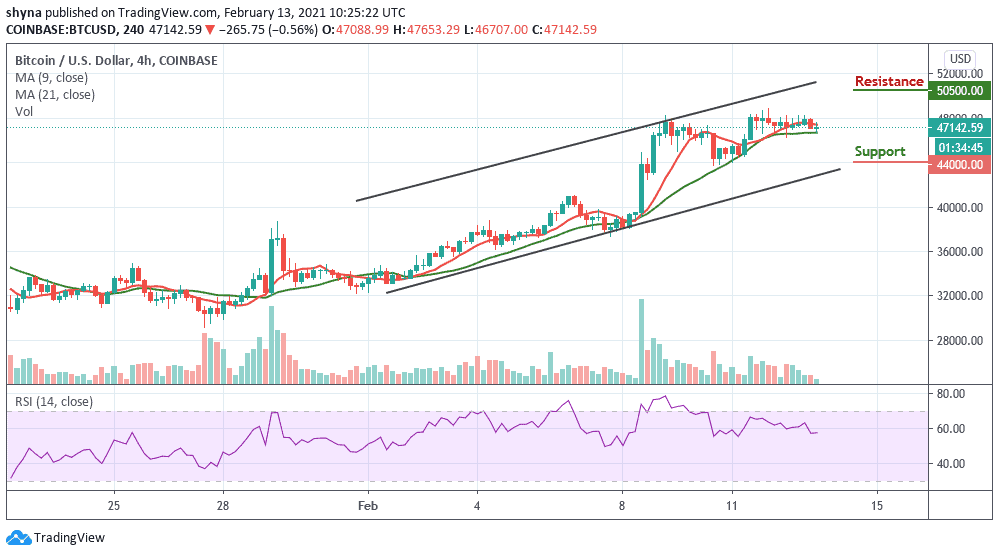
Meanwhile, the coin is still roaming around $47,142 as bears are pushing the price within the moving averages. Meanwhile, the $44,000 and below may come into play if the technical indicator RSI (14) moves below 50-level.
Join Our Telegram channel to stay up to date on breaking news coverage