Join Our Telegram channel to stay up to date on breaking news coverage
Bitcoin (BTC) Price Prediction – February 7
BTC/USD resumes the decline after consolidation in a narrow channel but the buying interest may increase on approach to $42,000.
BTC/USD Long-term Trend: Bullish (Daily Chart)
Key levels:
Resistance Levels: $44,500, $46,500, $48,500
Support Levels: $33,000, $31,000, $29,000
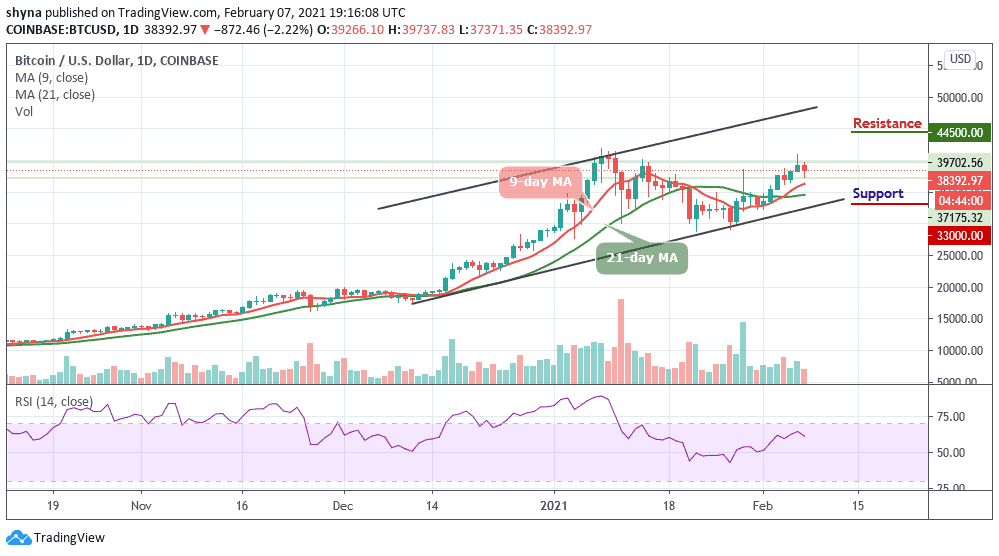
At the early hours of today, BTC/USD touches the high of $39,737 and now retreating to $38,000 at the time of writing. The Bitcoin price has been recovering slowly after a volatile start of the week. Meanwhile, the psychological barrier of $40,000 still serves as the first important resistance within the market. More so, a sustainable move above this level may likely push the price towards the upper boundary of the channel.
What to Expect from Bitcoin (BTC)
However, on the intraday chart, BTC/USD breaks below the resistance level of $39,266 which increased the selling pressure. At the time of writing, the price is hovering at the support created above the 9-day moving averages and if this is cleared, the sell-off may be extended to $35,000 which is around the 21-day moving average. In addition, the dips to $35,000 are likely to be bought, which means the overall bullish sentiments may prevail.
Moreover, if the price moves below the mentioned-support, $34,000 could come into focus which served as a support during the previous consolidation period while the critical supports lie at $33,000, $31,000, and $29,000. On the upside, the first resistance may come at $40,000. Once it is clear, $41,000 could come back into focus. Further bullish movement may hit the potential resistance levels at $44,500, $46,500, and $48,500 as the RSI (14) moves below 65-level.
BTC/USD Medium-Term Trend: Bullish (4H Chart)
The 4-hour chart shows that the Bitcoin bears are now stepping back into the market pushing the BTC price below its previous support level that existed around $30,000. Although the Bitcoin price has not yet slipped below $38,000, it’s still in the loop of making a bounce back.
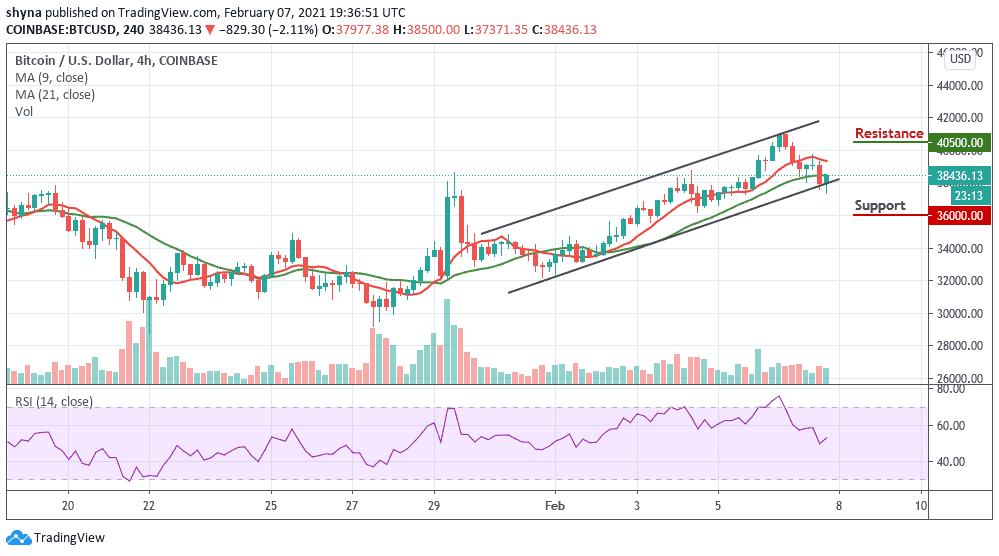
However, the Bitcoin price is currently hovering below the 9-day and 21-day moving averages at the time of writing. The upward movement may likely push the price to the nearest resistance of $40,500 and above while the immediate support lies at $36,000 and below. The RSI (14) is moving below the 55-level, which indicates more bearish signals.
Join Our Telegram channel to stay up to date on breaking news coverage
