Join Our Telegram channel to stay up to date on breaking news coverage
Bitcoin (BTC) Price Prediction – February 5
BTC/USD is now trying to recover the yesterday’s loss as it attempts to break back above the $38,000.
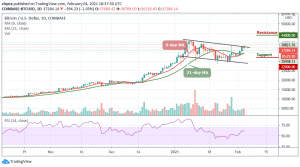
BTC/USD Long-term Trend: Bullish (Daily Chart)
Key levels:
Resistance Levels: $44,000, $46,000, $48,000
Support Levels: $32,000, $30,000, $28,000

BTC/USD is holding the $36,000 support and it could rise again in the near term. However, as the daily chart reveals, the king coin is now attempting to rebound higher. A few days ago, Bitcoin (BTC) managed to find support at $32,250 and now making its way toward the $38,000 region again. Moreover, despite all the recent declines in price, the Bitcoin (BTC) still remains up as the bullish run continues to drive prices higher.
What to Expect from Bitcoin (BTC)
Bitcoin is currently neutral at this moment in time and it may prevent itself from turning bearish if the coin can manage to break back above $38,000 pretty quickly. Similarly, for the coin to continue to create a short term bullish trend, it would need to break above $38,000. More so, if the bulls push higher, the first level of resistance lies at $40,000. Above this, resistance is located at $44,000, $46,000, and $48,000.
On the other hand, if the sellers push lower, supports could be located at $32,000, $30,000, and $28,000. If the selling pressure begins, more supports could play out. Meanwhile, as the daily chart reveals, the technical indicator RSI (14) is suggesting an upward movement for the coin where the signal line moves above the 60-level.
BTC/USD Medium – Term Trend: Bullish (4H Chart)
Looking at the 4-hour chart, the price of Bitcoin (BTC) is currently trading around $37,950 above the 9-day and 21-day moving averages after a reversal from $36,600 that occurs in the early hours of today. However, the 4-hour chart also shows that the bullish supply is coming up slowly in the market while the bears are also trying to bring the price down.
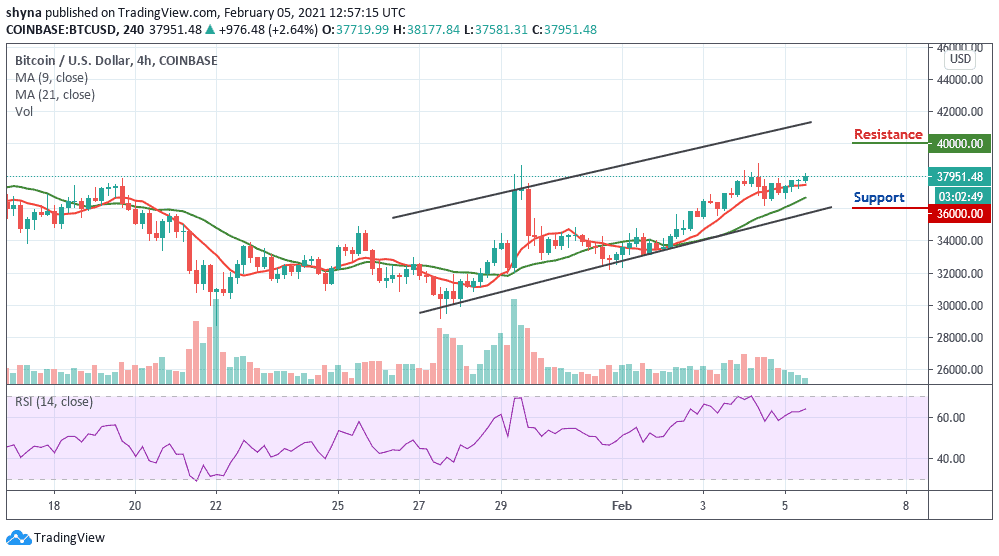
Furthermore, if the buyers could strengthen and energize the market more, they can further push the price to a $38,500 resistance level. Therefore, breaking the mentioned resistance may likely allow the bulls to test the $40,000 and above. In other words, the RSI (14) is currently moving towards the 65-level, but when it turns down; the bears could step back into the market and bring the price to the support level of $36,000 and below.
Join Our Telegram channel to stay up to date on breaking news coverage