Join Our Telegram channel to stay up to date on breaking news coverage
Bitcoin (BTC) Price Prediction – February 1
Bitcoin is fighting to hold above the $33,000 but overhead pressure continues to make this task a difficult one for the bulls.
BTC/USD Long-term Trend: Bullish (Daily Chart)
Key levels:
Resistance Levels: $38,000, $40,000, $42,000
Support Levels: $29,000, $27,000, $25,000
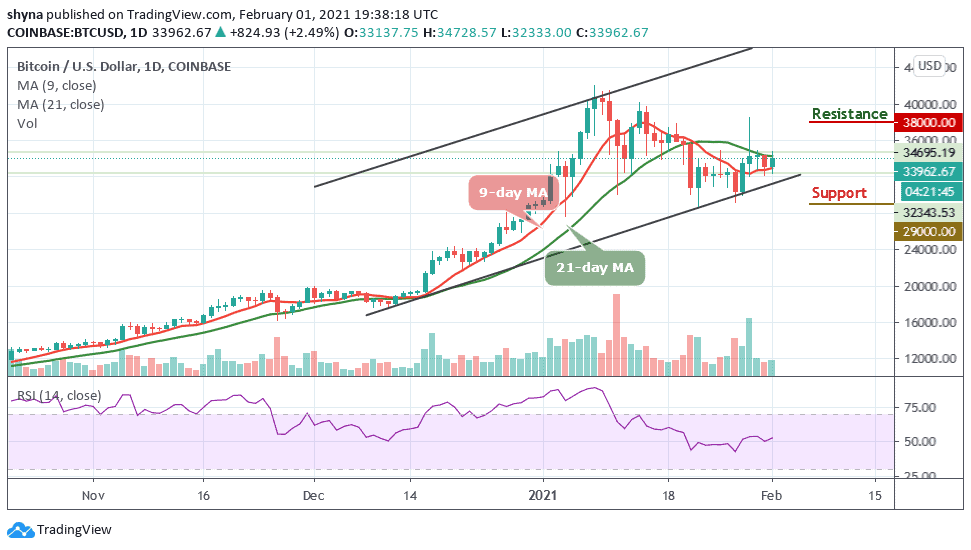
At the time of writing, BTC/USD is seeking support above $32,000 to avoid extending the bearish leg to $30,000. The 9-day moving average is also a key level in the mission to avert the losses, perhaps reverse the trend for gains heading to $35,000. Alternatively, the BTC bulls need to find acceptance above the intraday highs of $34,728 to refuel the recovery momentum.
Where is the Bitcoin Price Going Next?
The Bitcoin price is stable above $32,300 as it is currently attempting an upside break above the 21-day moving average. Meanwhile, a close above $34,000 could open the doors for a larger increase in the coming sessions. In the past few days, Bitcoin price traded in a range above the $30,000 support zone. More so, BTC/USD is slowly moving higher towards the $34,000 resistance level. The next key resistance level may be found at 36,000, above which the bulls are likely to hit the potential resistance at $38,000, $40,000, and $42,000 in the near term.
On the other hand, if there is no clear break above $32,000, there are chances of a fresh decline. However, as the 9-day MA remains below the 21-day MA, the coin may stay within the negative side and initial support is near the $31,000 level. The main support is now forming near the $30,000 level, below which the price could dive towards the supports of $29,000, $27,000, and $25,000 as the technical indicator RSI (14) remains above the 50-level.
BTC/USD Medium – Term Trend: Bullish (4H Chart)
On the 4-hour chart, a retest of $33,800 gives the impression that the bulls are not yet done. The Bitcoin price rises to fill a significant gap as the bulls remained in control which may take the coin towards the $34,000. In a short time, BTC/USD may hit $35,000 if the bullish pressure continues. Otherwise, the price may revisit the supports of $32,000 and below.
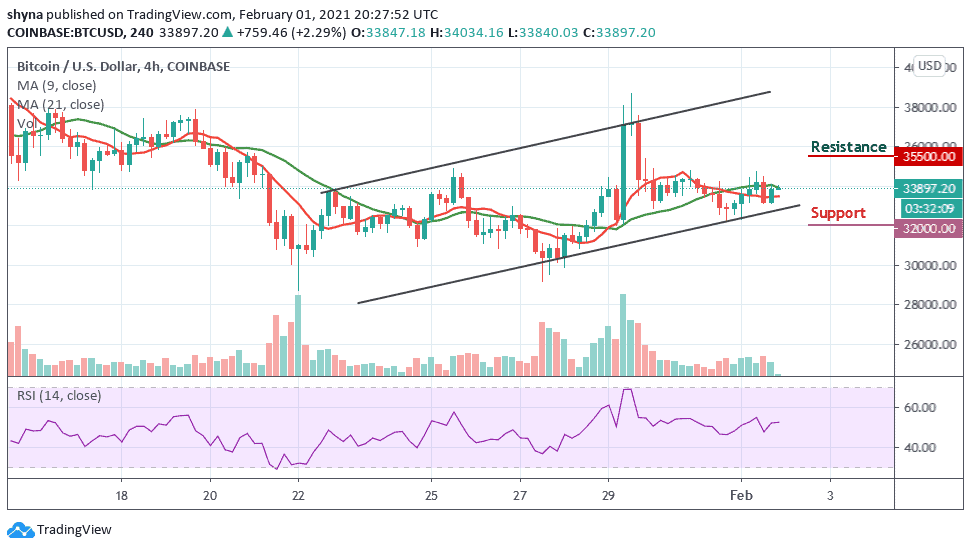
On the upside, a bullish move may hit the resistance at $35,500 and above. As of now, the RSI (14) is moving above 50-level, this could mean that the BTC/USD trading is looking for another close resistance. Meanwhile, a significant cross below the moving averages may send the market in a bearish scenario.
Join Our Telegram channel to stay up to date on breaking news coverage