Join Our Telegram channel to stay up to date on breaking news coverage
Bitcoin (BTC) Price Prediction – January 31
Bitcoin price is now showing signs of market correction as its price moves below $33,000 to touch the low of $32,200.
BTC/USD Long-term Trend: Bullish (Daily Chart)
Key levels:
Resistance Levels: $38,000, $40,000, $42,000
Support Levels: $29,000, $27,000, $25,000

BTC/USD is currently trading below the $33,000 level as the price crosses below the 9-day and 21-day moving averages. However, the consolidation could be coming to an end according to derivatives data indicating that the king coin might soon drop more before climbing higher again.
What to Expect from Bitcoin (BTC)
Presently, BTC is changing hands at $32,663, which marks a significant rally below the moving averages. However, where BTC trends next may partly depend on whether or not sellers can close today’s candle below the $32,000 level. Should in case this comes to play, it may propel prices lower. And traders expect BTC/USD to fall below $30,000 support which could later move towards the critical support levels at $29,000, $27,000, and $25,000.
On the other hand, if the Bitcoin price failed to close below the $33,000 level; the price could rise above the 9-day and 21-day moving averages. A further bullish movement could send the price to $38,000, $36,000, and $34,000 resistance levels. The technical indicator RSI (14) has recently revealed a sign of trend reversal, which shows a possible bearish momentum.
BTC/USD Medium – Term Trend: Ranging (4H Chart)
On the 4-hour chart, BTC/USD is currently trading around $32,945 under the 9-day and 21-day moving averages after a reversal from $34,387 where the market started trading today while the Bitcoin price is now moving towards the south.
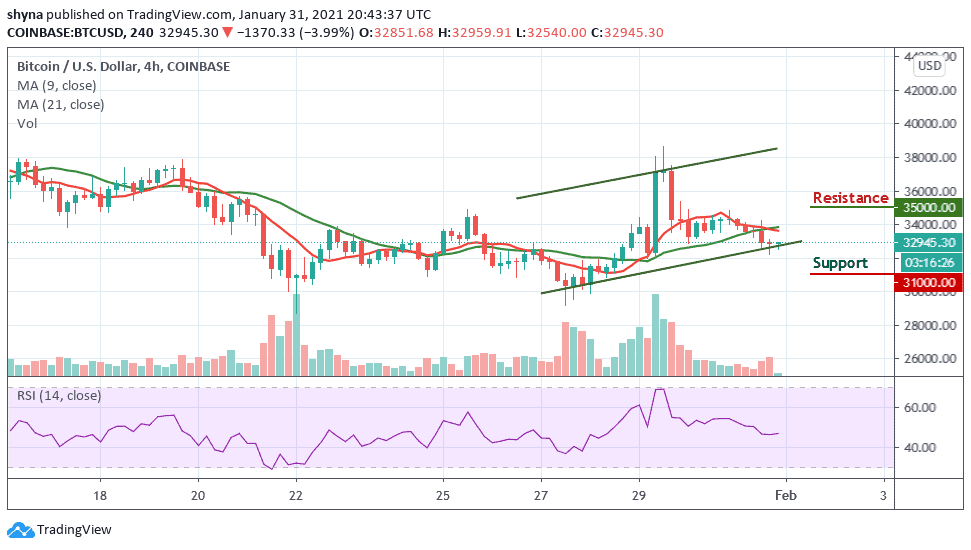
However, if buyers could strengthen and energize the market, they can further push the price above the moving averages and this could allow the market price to test the $38,000 and above. The RSI (14) is currently moving below 50-level, but a further movement to the south may drag the price to the support level of $29,000 and below.
Join Our Telegram channel to stay up to date on breaking news coverage