Join Our Telegram channel to stay up to date on breaking news coverage
Bitcoin (BTC) Price Prediction – January 16
The Bitcoin (BTC) keeps experiencing some intense turbulence, with bulls losing their edge over the cryptocurrency’s price action.
BTC/USD Long-term Trend: Bullish (Daily Chart)
Key levels:
Resistance Levels: $40,000, $42,000, $44,000
Support Levels: $32,000, $30,000, $28,000
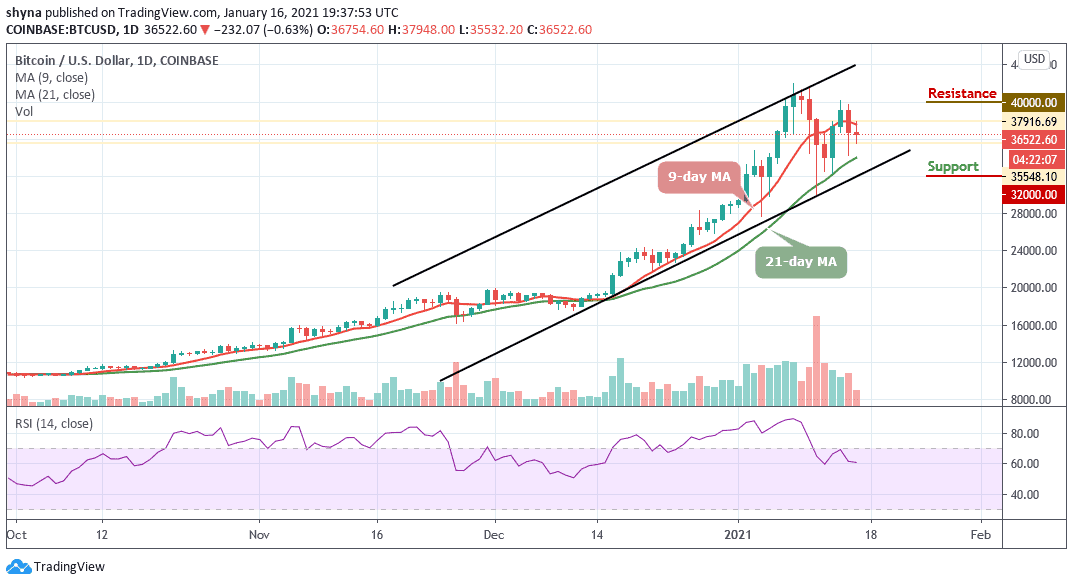
At the time of writing, BTC/USD is trading down just under 0.63% at its current price of $36,522. This marks a notable decline from recent highs of $39,697 that was set yesterday. More so, the entire market trends next may undoubtedly depend largely on whether or not bulls can create any long-term support in the lower $30,000. Moreover, a break below here could lead to a serious downside for the entire market and potentially mark an end to the crypto’s uptrend.
What is the Next Direction for Bitcoin?
According to the daily chart, BTC/USD could not break the all-time high past $42,000. The king coin, at the moment, is moving downhill. Meanwhile, Bitcoin touches the daily high at $37,948 at the beginning of the day, but only to go down to the low at $35,532. After gaining some momentum, the Bitcoin price now finds stability around the $36,000 range, trading at $36,522.
In the meantime, Bitcoin is trading within the 9-day and 21-day moving averages amid a building bearish momentum. The RSI (14) is about to cross below the 60-level, suggesting more downtrends. More so, BTC/USD is still fighting to correct the subtle bearish movement, and the bullish trend coupled with the right volume and high volatility levels is the right ingredient for the recovery to $38,000 in other to resume its upward movement towards $40,000, $42,000, and $44,000 resistance levels while the supports are located at $32,000, $30,000, and $28,000.
BTC/USD Medium-Term Trend: Bullish (4H Chart)
Checking the 4-Hour chart, BTC/USD is currently trading below the 9-day and 21-day moving averages. Meanwhile, the Bitcoin price has not yet slipped below $35,000 and still in the loop of breaking or making a bounce back. At the moment, the BTC price hovers at $36,477 and may take time to persistently trade above $38,000. The upward movement may likely hit the resistance level of $40,000 and above if the bulls regroup again.
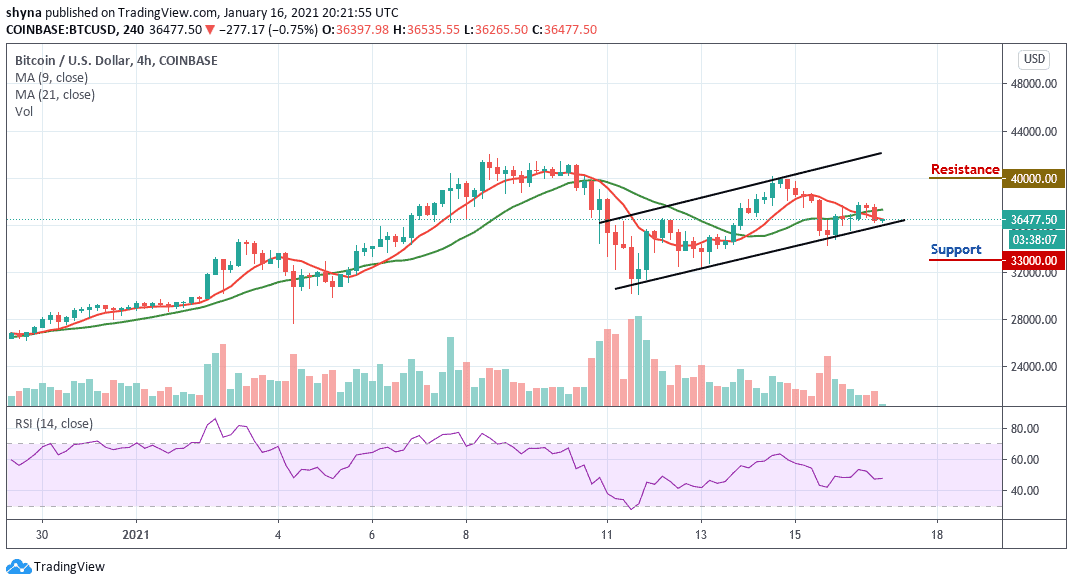
On the downside, the price could fall below the lower boundary of the channel, a further movement could test the critical support at the $33,000 level and below. The RSI (14) moves below the 50-level, indicating a sideways movement.
Join Our Telegram channel to stay up to date on breaking news coverage