Join Our Telegram channel to stay up to date on breaking news coverage
Bitcoin (BTC) Price Prediction – January 11
A few days ago, Bitcoin (BTC) started a sharp decline from the $41,406 resistance and currently declined towards $30,100, but it is likely to find strong bids near $28,000.
BTC/USD Long-term Trend: Bullish (Daily Chart)
Key levels:
Resistance Levels: $43,000, $45,000, $47,000
Support Levels: $26,300, $24,300, $22,300
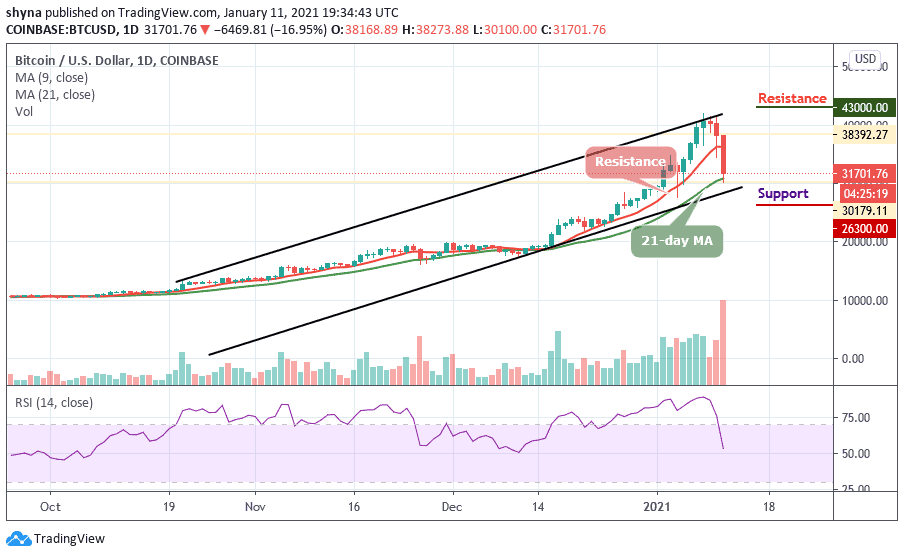
On the daily BTC/USD chart, we can see that price levels have rapidly declined to result in Bitcoin dropping over $8,000 within the space of 3days. Today, short-term price action has formed a wedge that has clearly broken to the downside. This has resulted in price levels attempting to continue the downtrend. Selling volume is flooding the market and the market price may likely go below the lower boundary of the channel.
What is the Next Direction for Bitcoin?
Currently, BTC/USD is trading at $31,701 but if the bulls could push the price above the 9-day and 21-day moving averages, the next resistance levels may be found at $43,000, $45,000, and $47,000. Typically when the new uptrends are beginning to form, traders may use the lower boundary of the channel as the nearest support level.
However, if the market price continues to drop, we may see a price cut below the channel. A further low drive could send the price to $26,300, $24,300, and $22,300 supports. For now, the bulls are making an attempt to defend the critical support. But as things stand, BTC/USD price may continue to drop as the technical indicator RSI (14) is about to cross below the 50-level, suggesting more bearish signals.
BTC/USD Medium-Term Trend: Bearish (4H Chart)
Looking at the 4-hour chart, the bears have been dominating the market since the beginning of today’s trading as the bulls are making an attempt to step back into the market, trying to defend the $30,000 support. If not, the $28,000 and below may come into play if BTC breaks below the mentioned supports.
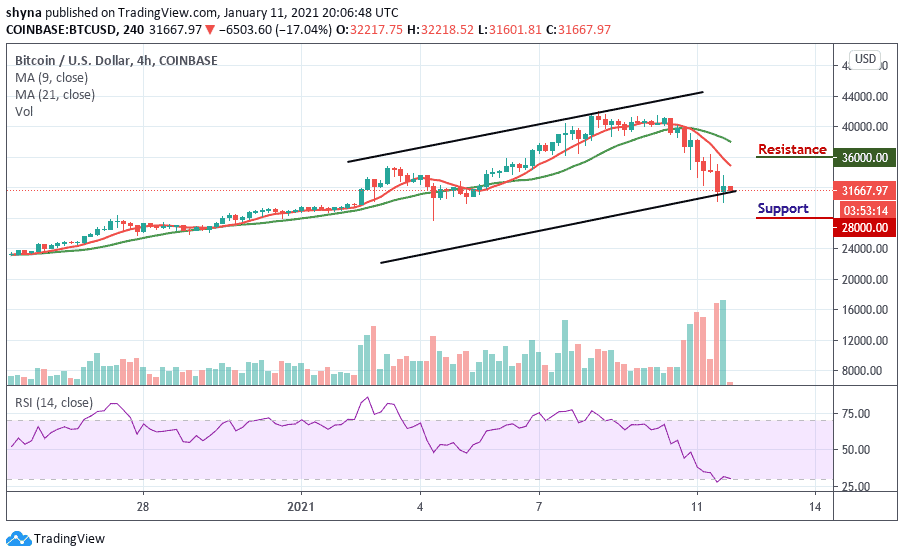
However, in as much as the buyers can reinforce and power the market, traders can expect a retest at a $34,000 resistance level, and breaking this level may further push the price towards the resistance level of $36,000 and above. The RSI (14) is moving into the oversold zone, indicating more bearish signals.
Join Our Telegram channel to stay up to date on breaking news coverage