Join Our Telegram channel to stay up to date on breaking news coverage
Bitcoin (BTC) Price Prediction – December 22
The price of Bitcoin is back above $23,000 as the recovery is coming up slowly.
BTC/USD Long-term Trend: Bearish (Daily Chart)
Key levels:
Resistance Levels: $26,000, $26,200, $26,400
Support Levels: $20,000, $19,800, $19,600
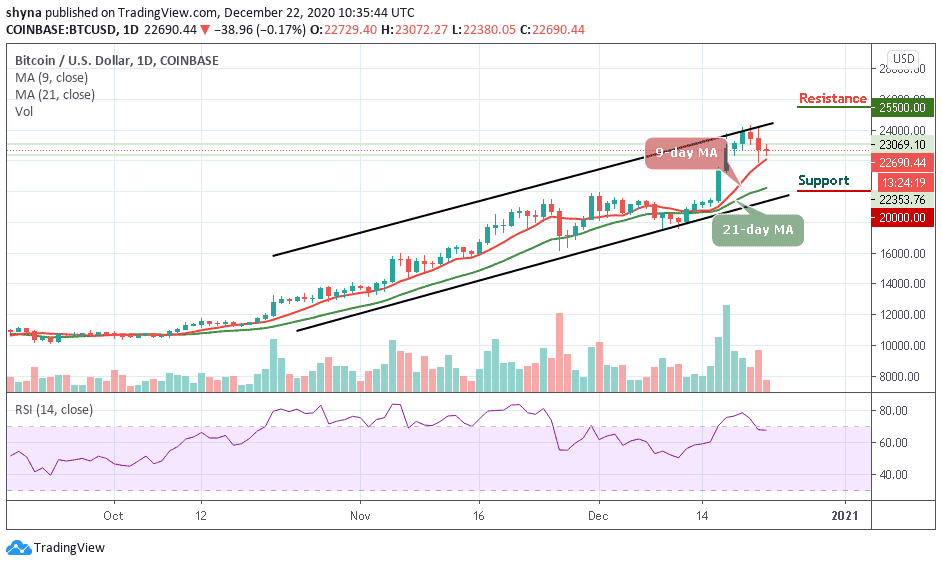
BTC/USD price recovers back above the moving averages. If the coin remains within this boundary, then the expectation of quick recovery could turn out to be true. At the moment, BTC/USD is seen trading at $23,477 after soaring to $23,628 in the past few hours. The first digital asset is also seen retreating to where it is trading currently and may likely head downwards if the bears step back into the market.
What to Expect from Bitcoin (BTC)
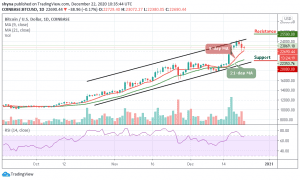
On the bullish side, it is important for Bitcoin to remain above the 9-day and 21-day moving averages within the ascending channel and confirm it otherwise there can come a bearish breakdown when BTCUSD falls below that barrier. Meanwhile, the technical indicator RSI (14) is making an attempt to step back into the overbought region.
However, BTC/USD will confirm the bullish trend if the market price moves above the upper boundary of the channel while it may continue the bearish trend if the price moves below the moving averages. Meanwhile, a strong bullish spike above the channel may likely take the price to the resistance levels of $26,000, $26,200, and $26,400.
Nevertheless, if the market decides to follow the downward trend, the Bitcoin price may likely retest the nearest support at $22,500, and should this support fails to contain sell-off, the market may experience another drop to the critical supports of $20,000, $19,800, and $19,600.
BTC/USD Medium-Term Trend: Ranging (4H Chart)
According to the 4-hour chart, BTC/USD is trading within the range of $22,622 to $24,045. However, the intraday trading is still looking bullish; at the beginning of today’s trading at $22,729 which is now a key support level. Meanwhile, the next key support levels are located at $22,500 and below.
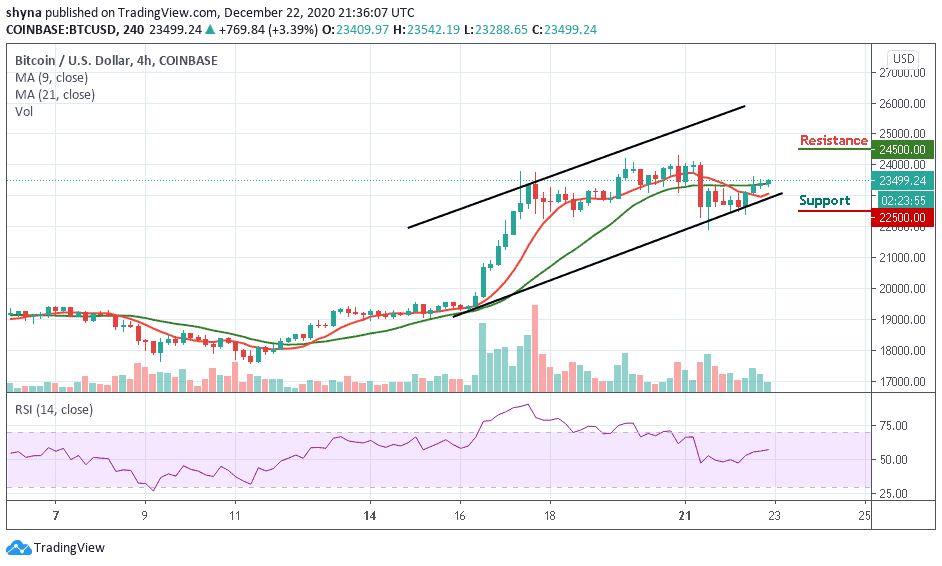
However, in as much as the buyers continue to reinforce and power the market more, traders can expect a retest at the $24,000 resistance level, and breaking this level may further push the price towards the resistance level of $24,500 and above. Similarly, the RSI (14) is moving around the 55-level to confirm the sideways movement.
Join Our Telegram channel to stay up to date on breaking news coverage