Join Our Telegram channel to stay up to date on breaking news coverage
Bitcoin and other cryptocurrencies have started to fall approaching their present support levels. If their respective existing supports continue to hold, the prices of the cryptocurrencies will rise. On the other side, once some cryptocurrencies lose their current support levels, they will drop to the bottom of the chart.
BTC/USD Major Trend: Bearish
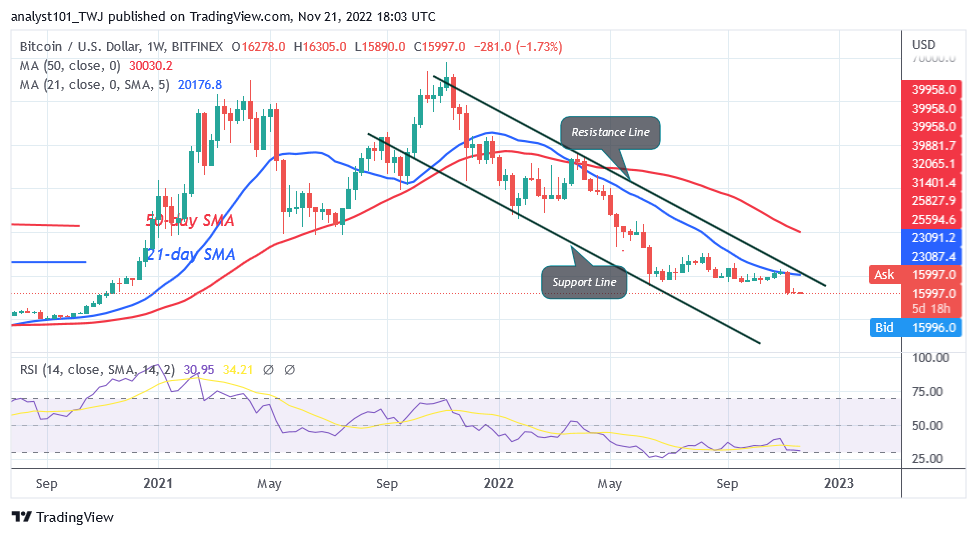
Bitcoin’s (BTC) price is falling, but selling pressure has returned below the $16,000 level of support. The largest cryptocurrency is testing the $15,588 level of support once more. If the present slide continues, Bitcoin may reach the next support level at $14,100. In other words, the price will rebound where the existing support holds. If the price rises, Bitcoin will reach a high of $17,200. On the plus side, Bitcoin will surge to the $20,000 high if the BTC price overcomes the $17,200 obstacle.
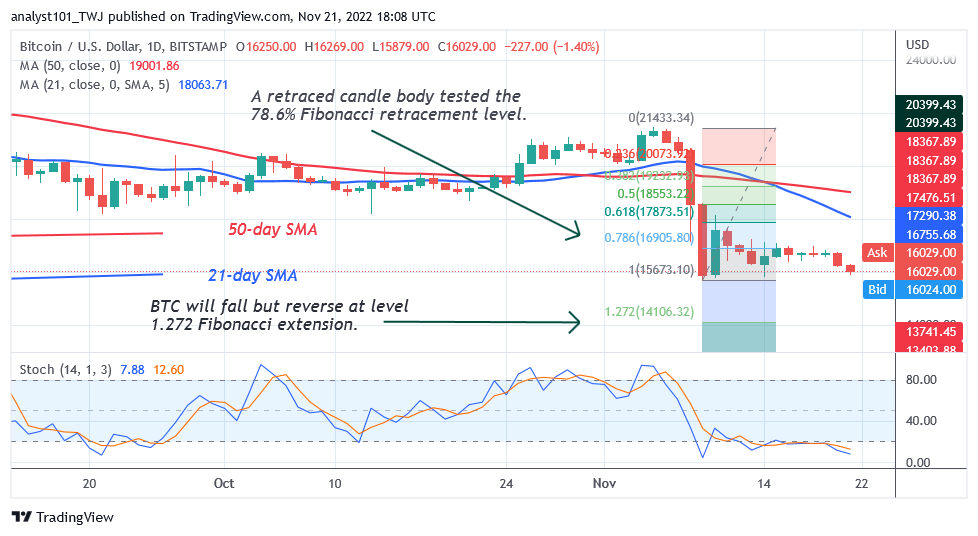
The largest cryptocurrency will drop by an extra $14,106.32 if Bitcoin declines and the existing support is breached. As a result, there will be panic buying and selling among buyers and sellers. While at level 31 of the Relative Strength Index for period 14, the price of BTC is moving downward with a bearish momentum. In the area of the bearish trend, cryptocurrency can continue to decrease.
SAND/USD Major Trend: Bearish
The Sandbox (SAND) is in a slump as the price breaches the $0.55 support level and resumes selling pressure. The oversold area of the market is where the cryptocurrency has declined.
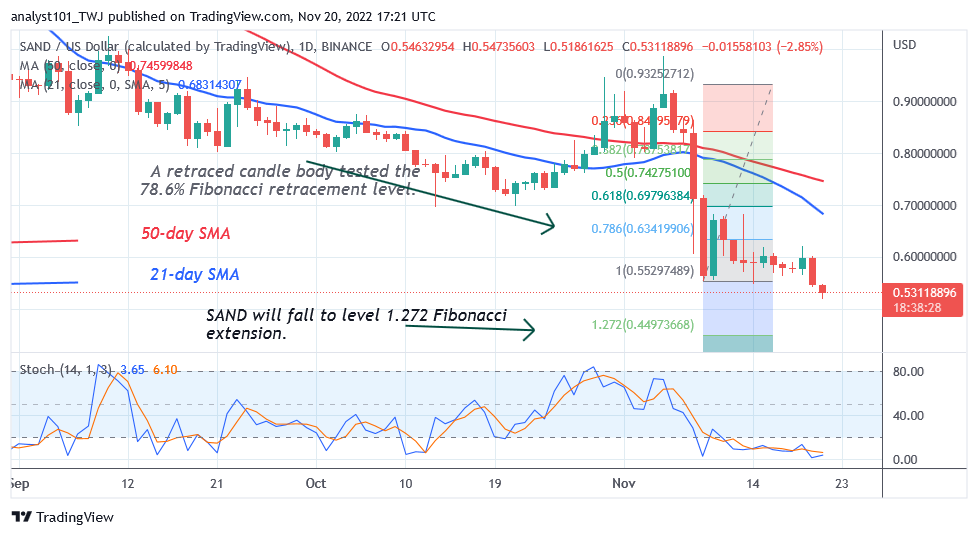
At level $0.44, the current fall will turn around. On November 9, SAND performed an upward corrective during the bearish trend, and a candle body tested the 78.6% Fibonacci retracement line. The correction predicts that SAND will decline but reverse at level 1.272 Fibonacci extension, or $0.44. The daily Stochastic is below level 30 indicating bearish fatigue. As buyers show up in the oversold area, the altcoin is likely to resume upward.
MANA/USD Major Trend: Bearish
The Decentraland (MANA) has dropped to a low of $0.37 and is currently in a decline. As the altcoin enters bearish exhaustion, the coin is anticipated to reverse to the level of $0.37.
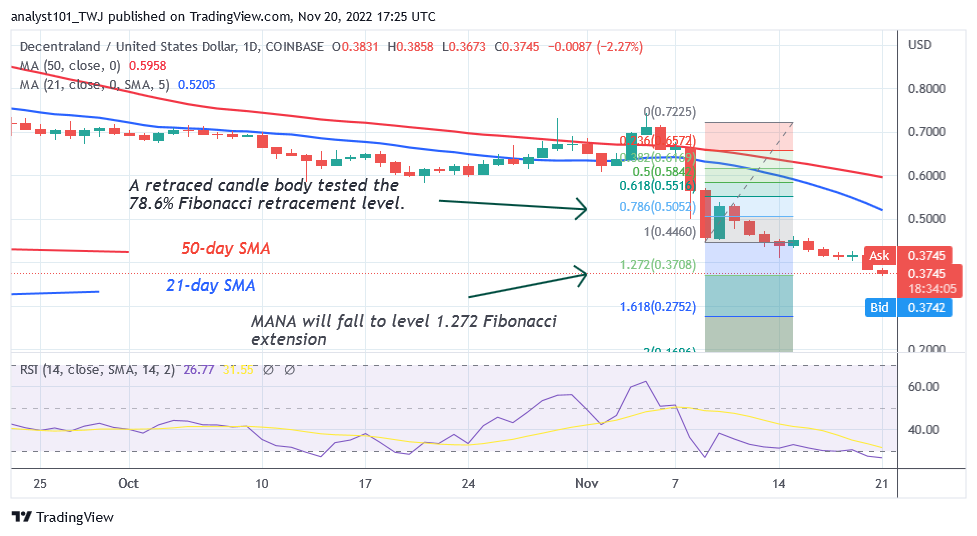
On November 9, MANA used a candle body to test the 78.6% Fibonacci retracement level. The correction predicts that MANA will fall but then turn around at the level 1.272 Fibonacci extension, or $0.37. MANA has achieved the Fibonacci extension and may reverse it. At level 26 on the Relative Strength Index for period 14, the coin is oversold.
APE /USD Major Trend: Bearish
Apecoin (APE) price which oscillates above the $2.78 support, is in a negative trend. If the price breaks through the existing support, the selling pressure will pick up again.
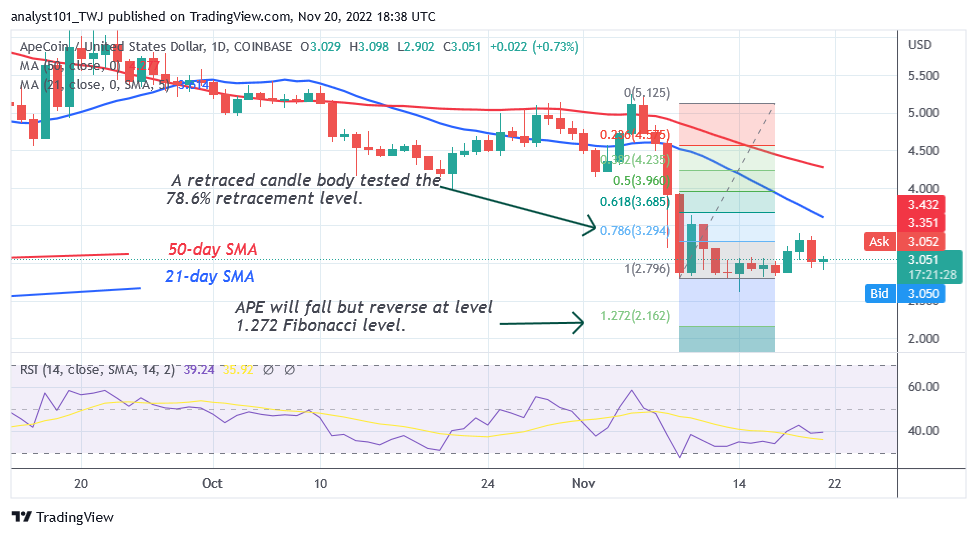
APE produced an upward corrective on the downtrend of November 9, and a candle body tested the 78.6% retracement line. According to the correction, APE will decline but turn around at level 1.272 of the Fibonacci sequence, or $2.16. APE is currently trading at $3.05 at the time of writing. If the altcoin holds above the current support, the cryptocurrency could recover. On the Relative Strength Index for period 14, the coin is at level 39, which is in the downtrend zone. As it gets closer to the oversold area, Apecoin is likely to continue to decrease.
ENJ /USD Major Trend: Bearish
Enjin Coin (ENJ) has reached a low of $0.28 and is currently in a downtrend. The altcoin has been trading in the oversold area of the market since November 9.
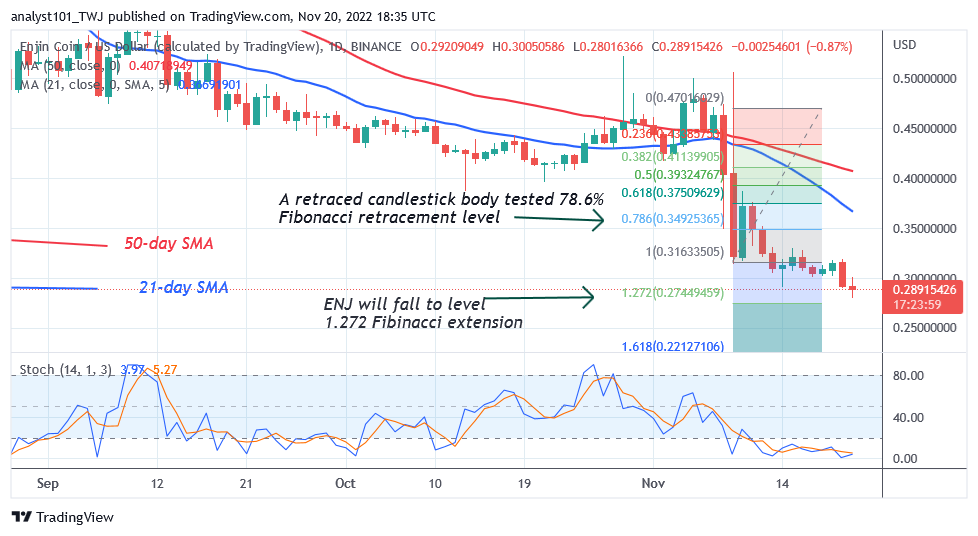
The altcoin has dropped to a low of $0.28 today. On November 9, ENJ made an upward reversal, and the 78.6% Fibonacci retracement line was tested by a candle body. After the correction, ENJ is predicted to fall or turn around at $0.27, the price of the Fibonacci extension. According to the price movement, the altcoin is getting close to level 1.272 Fibonacci extension, which will indicate a reversal. It is currently trading below level 20 of the daily Stochastic in the oversold area.
As cryptocurrency prices return to their prior low, selling pressure on Bitcoin and the altcoins has resumed. Traders will engage in panic buying and selling if Bitcoin drops below the $15,500 support level. This is the reason Dash 2 Trade is made to advance your cryptocurrency trading. A novel platform like Dash 2 Trade would have red-flagged the FTX disaster. This is an innovative bundle of tools: analytics, metrics, signals, auto-trading, and analysis tools. Right now, the D2T presale is on and it has raised close to $7 million.
Related
Join Our Telegram channel to stay up to date on breaking news coverage


