Join Our Telegram channel to stay up to date on breaking news coverage
The Bitcoin price prediction shows that BTC is trading below the moving averages as the coin touches $18,563 support.
Bitcoin Prediction Statistics Data:
- Bitcoin price now – $18,625
- Bitcoin market cap – $357.9 billion
- Bitcoin circulating supply – 19.1 million
- Bitcoin total supply – 19.1 million
- Bitcoin Coinmarketcap ranking – #1
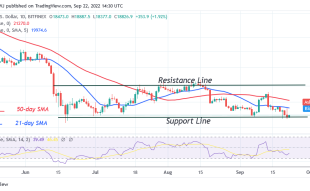
BTC/USD Long-term Trend: Ranging (Daily Chart)
Key levels:
Resistance Levels: $23,000, $25,000 $27,000
Support Levels: $16,000, $14,000, $12,000
Your capital is at risk
BTC/USD continues to face a setback that could be a permanent one as the king coin may have an additional bearish run below the lower boundary of the channel. Currently, Bitcoin (BTC) is trading around the $19,067 level after a free fall from $19,500 during the European.
Bitcoin (BTC) May Stay Below the Moving Averages as Tamadoge (TAMA) Increases
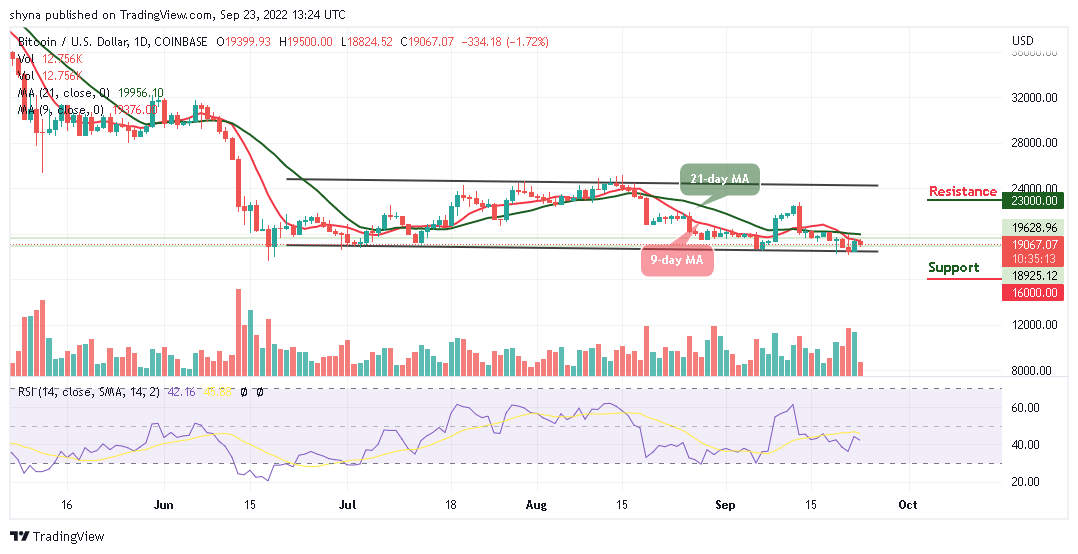
Looking at the daily chart, the Bitcoin price is currently nose-diving below the 9-day and 21-day moving averages. If the price should slump below the support level of $18,000, the king coin is likely to face a downward trend. However, the further bearish movement could locate the supports at $16,000, $14,000, and $12,000, making room for BTC to fall even further.
However, the technical indicator Relative Strength Index (14) is likely to cross below the 40-level as the trading volume could be in support of the bears. Moreover, if bulls decide to move the price above the moving averages, BTC/USD may move towards the resistance levels of $23,000, $25,000, and $27,000.
BTC/USD Medium-term Trend: Bearish (4H Chart)
On the 4-Hour chart, the Bitcoin price crosses below the 9-day and 21-day moving averages as the immediate support could come at the $17,500 level. Meanwhile, the market price may likely fall below the support at $18,000 if the bears continue to dominate the market.
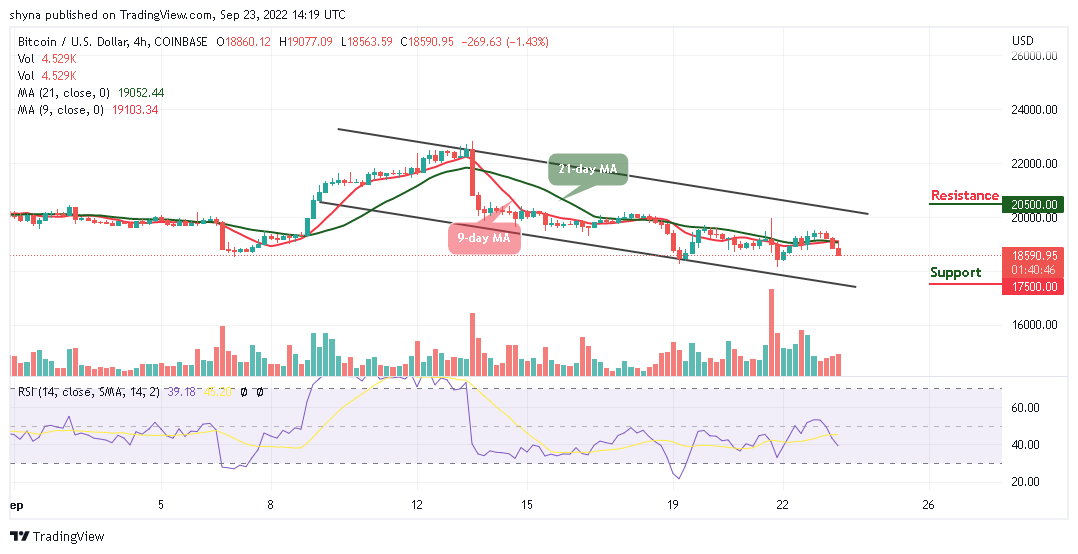
However, a further bearish movement could hit the critical support at the $17,500 level and below while the resistance is located above the upper boundary of the channel at $20,500 and above. Meanwhile, the Bitcoin price is currently moving on the negative side as the technical indicator Relative Strength Index (14) is moving to cross below the 40-level.
The Tamadoge project has several new exchange listings planned however OKX will be its initial exchange offering (IEO), i.e. the first place to support trading of Tamadoge.
Related:
- How to Buy Tamadoge
- Visit Tamadoge Website
Join Our Telegram channel to stay up to date on breaking news coverage