

Join Our Telegram channel to stay up to date on breaking news coverage
The Bitcoin price prediction shows that BTC Bears are trading below the moving averages as the coin touches $23,180 support.
Bitcoin Prediction Statistics Data:
- Bitcoin price now – $23,375
- Bitcoin market cap – $445.5 billion
- Bitcoin circulating supply – 19.1 million
- Bitcoin total supply – 19.1 million
- Bitcoin Coinmarketcap ranking – #1
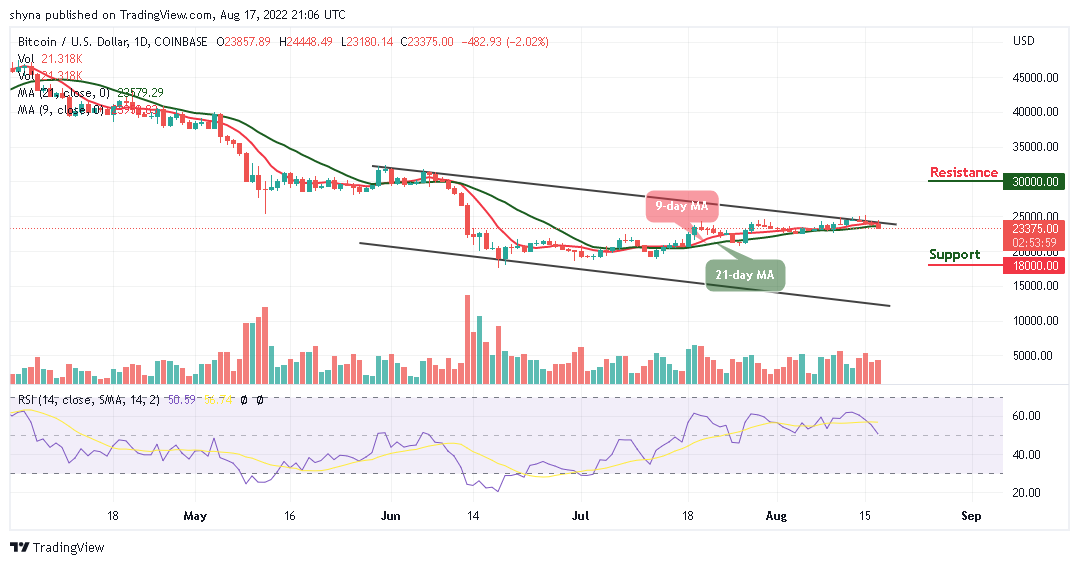
BTC/USD Long-term Trend: Ranging (Daily Chart)
Key levels:
Resistance Levels: $30,000, $32,000 $34,000
Support Levels: $18,000, $16,000, $14,000
Your capital is at risk
BTC/USD continues to face a setback that could be a permanent one. The king coin is likely to have an additional bearish run but a price rally may help the coin to head to the south as the red line of the 9-day moving average could go below the green line of the 21-day moving average. Currently, Bitcoin (BTC) is trading around the $23,375 level after a free fall from $24,448 during the European.
Bitcoin (BTC) May Stay Below the Moving Averages While Tamadoge (TAMA) Increases
The Bitcoin price is currently nose-diving below the 9-day and 21-day moving averages. If the price should slump below the support level of $23,000, the king coin is likely to face a downward trend. However, the further bearish movement could locate the supports at $18,000, $16,000, and $14,000, making room for BTC to fall even further.
However, the technical indicator Relative Strength Index (14) is likely to cross below the 50-level as the trading volume could be in support of the bears. Moreover, if bulls decide to move the price above the upper boundary of the channel, BTC/USD may move towards the resistance levels of $30,000, $32,000, and $34,000.
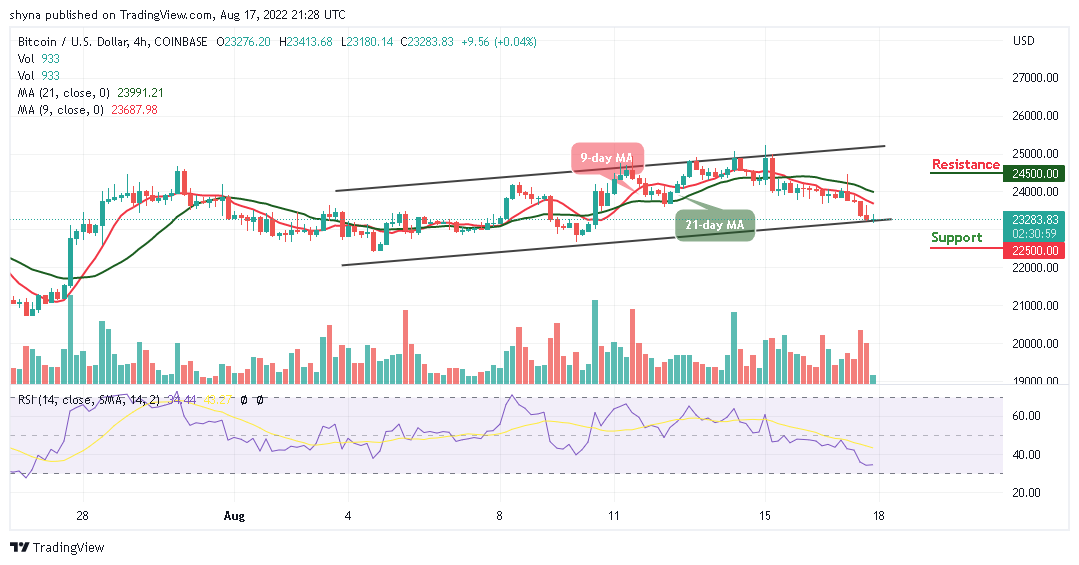
BTC/USD Medium-term Trend: Ranging (4H Chart)
On the 4-Hour chart, the Bitcoin price remains below the 9-day and 21-day moving averages and the immediate support is likely to come at the $23,000 level. The price may likely fall below this level if the bears continue to dominate the market.
However, a further bearish movement could hit the critical support at the $22,500 level and below while the resistance is located above the moving averages at $24,500 and above. Meanwhile, the Bitcoin price is currently moving on the positive side as the technical indicator Relative Strength Index (14) is likely to cross above the 40-level.
“The Tamadoge team is celebrating the notable success of the presale by launching a $100,000 giveaway. There are multiple ways that people can participate in the prize pool. However, the requirement for those who want to participate in the prize pool is to hold a minimum of $100 worth of TAMA tokens on the day of the draw.”
Related
Join Our Telegram channel to stay up to date on breaking news coverage
