
Join Our Telegram channel to stay up to date on breaking news coverage
The BLUR airdrop has been one of the biggest trends in the crypto space this week. This was marked by redemptions and price surges. At the time of writing, BLUR price is up 36% from its listing price on Coinbase a few days ago. The price of the Blur NFT exchanges token was 33% up on the day with a daily trading volume of $634 million.
$BLUR is now LIVE
All traders across all marketplaces in the last 3 months, Care Package holders, and Creators are eligible for the airdrop.
You have 60 days to claim your BLUR ⏰ pic.twitter.com/AZynnHeIhz
— Blur (@blur_io) February 14, 2023
After Coinbase’s Twitter announcement that the U.S.-based exchange was listing the token, BLUR has become one of the most talked about altcoins in the NFT space. Will this reflect how the price performs going forward?
Is It Possible For Blur Price To Reach $10?
Despite listing at $0.88 on Coinbase, the price action has seen huge volatility with the value topping out at $1.21 on Thursday (see chart below). This slowly bled out to reach a low of $0.86 followed by a steady rise until the current price level of $1.20.
This price action has led to the appearance of a rounded bottom pattern on the hourly chart. This pattern appears when an asset initially descends toward a low, indicating an excess of supply. A reversal to an upward trend occurs when buyers enter the market on the dips, which increases demand for the asset. Once the rounding bottom is complete, the asset breaks out to start a massive move upward.
In the case of BLUR, a breakout from the rounding bottom chart pattern would be confirmed when a daily candlestick close is achieved above the price immediately prior to the start of the initial decline – in this case, the $1.21 mark. If this happens, the asset could rise 30% to reach the target of the prevailing chart pattern around $1.57.
In highly ambitious cases, the buyers may be bolstered to push the price higher. If this happens, a climb to $10 may be possible, but after a few instances of retracements and recoveries.
BLUR/USD Hourly Chart
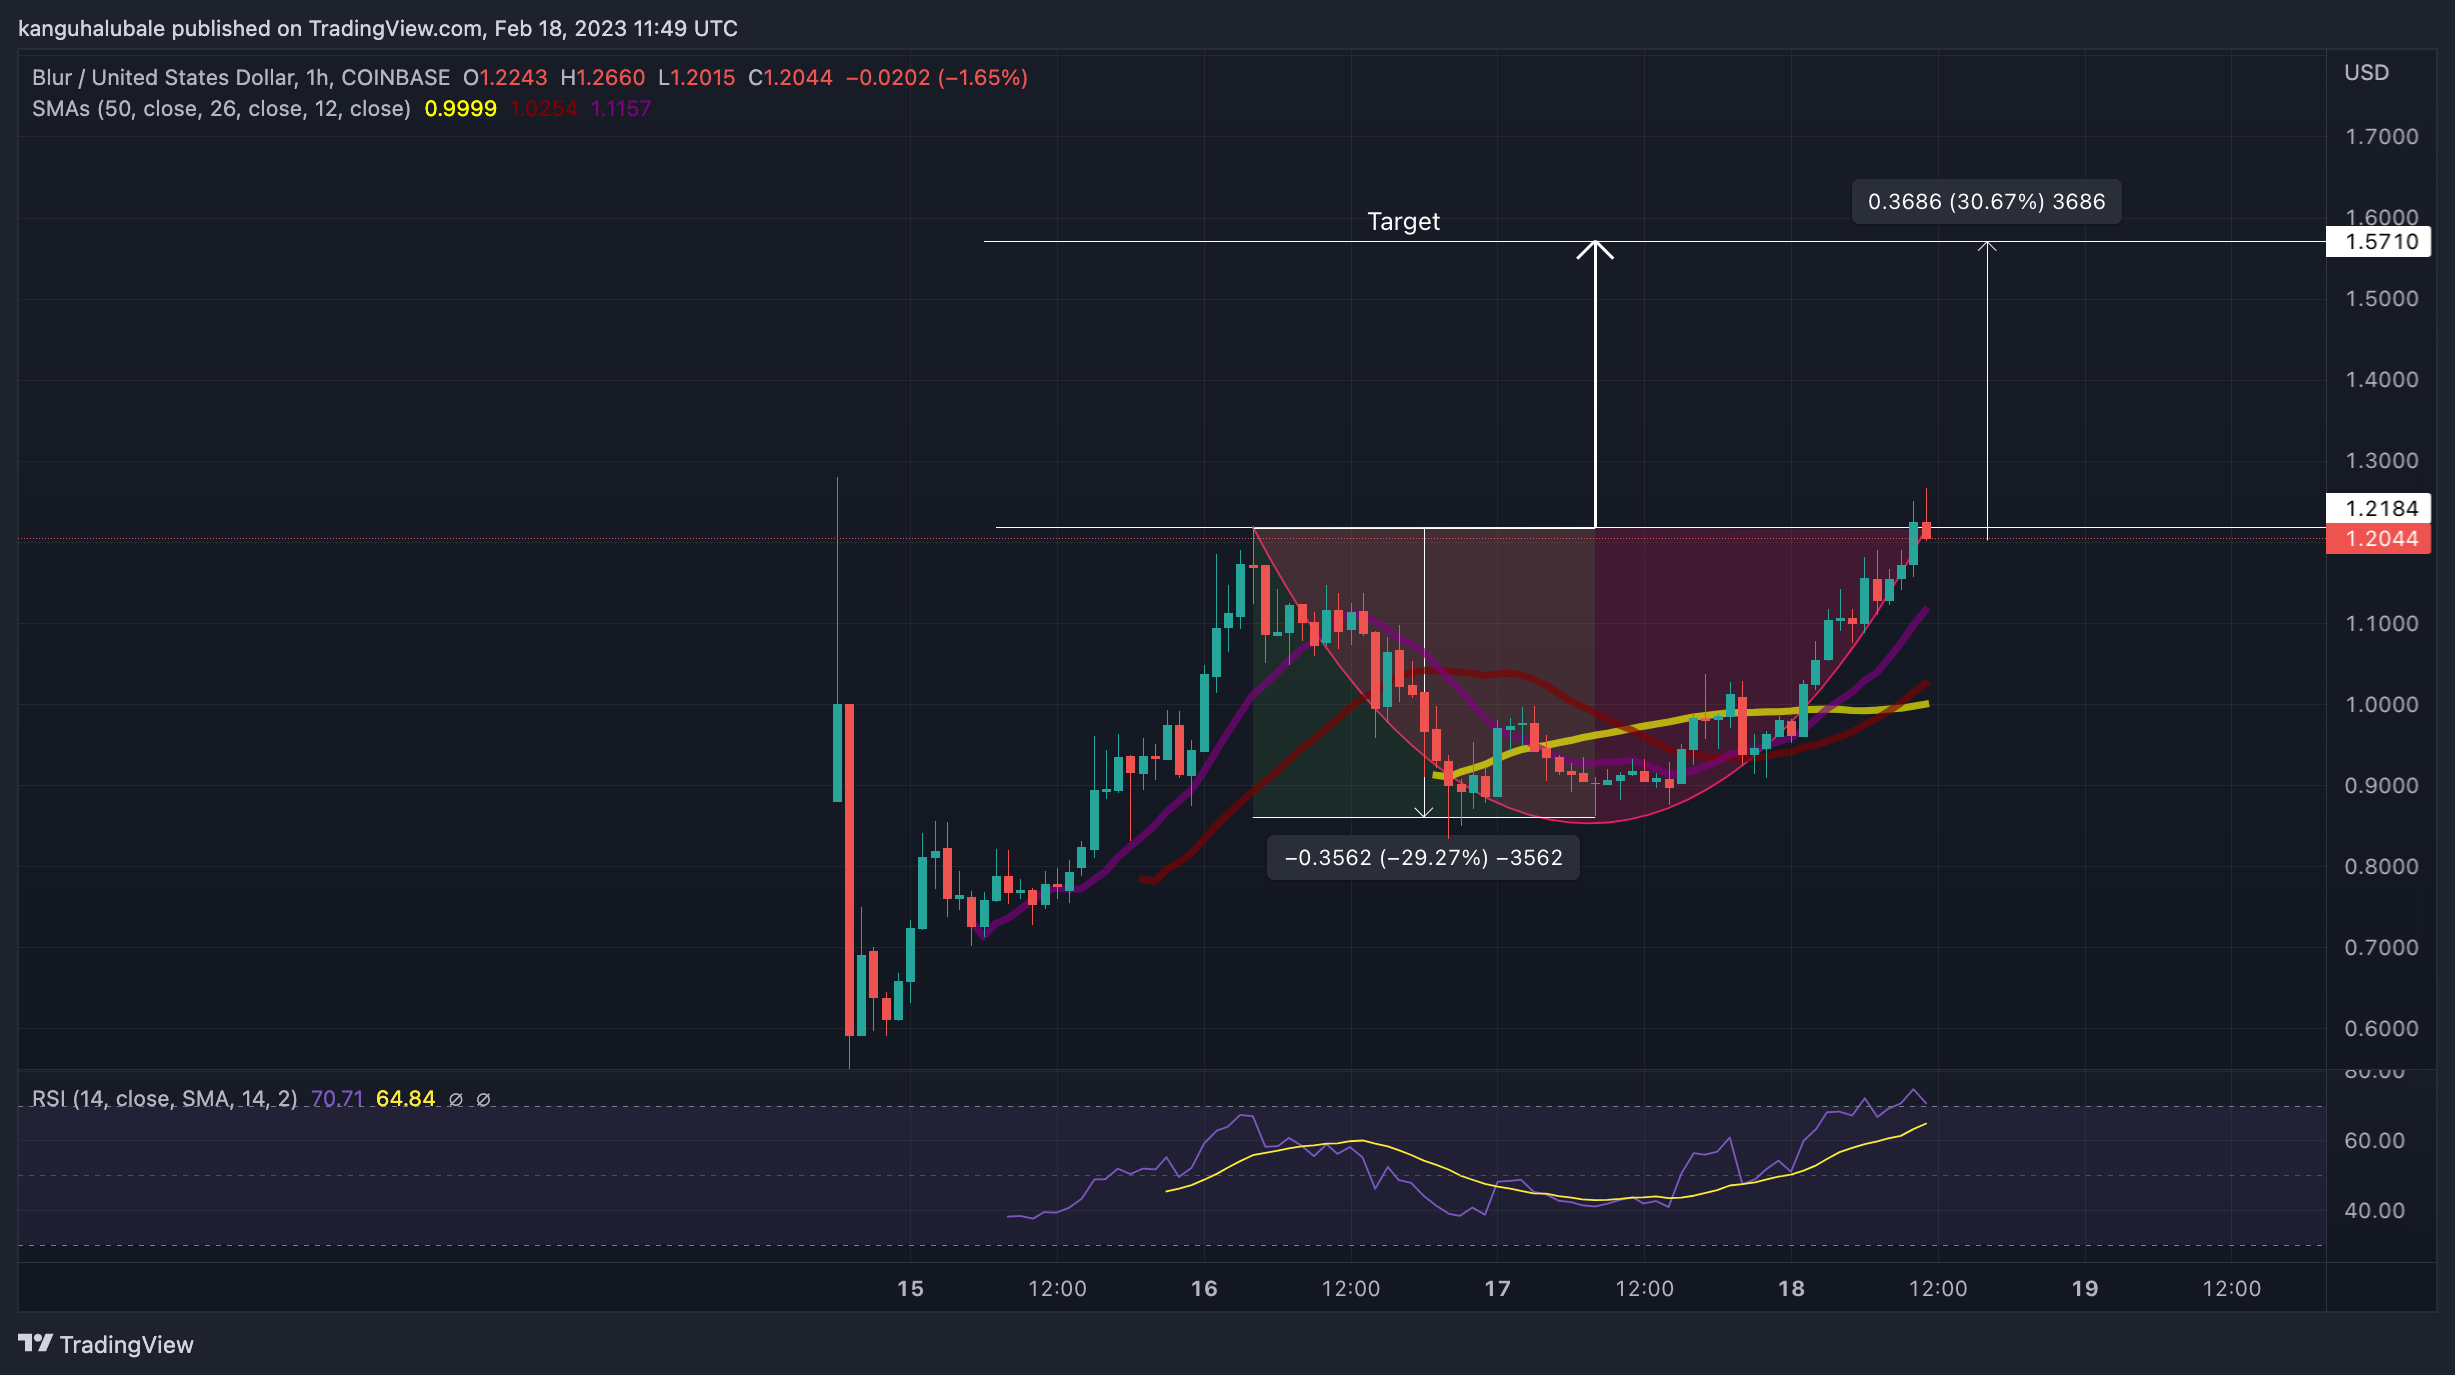
Apart from the technical chart pattern, the upward-facing moving averages showed that BLUR’s uptrend was strong. This was also validated by recent bullish crosses from the Simple Moving Averages (SMAs), the latest one being when the 26-hourly SMA crossed above the 50-hourly SMA. This suggested that there were more buyers than sellers in the market, hence the current correction might be short-lived.
In addition, these SMAs provided strong support for the ERC-20 governance token on the downside. These demand areas would cushion investors from any selling pressure threatening to pull the price lower.
Conversely, the Relative Strength Index (RSI) was moving down away from the overbought region. Although the price strength at 70 indicated there were more bulls than bears in the market, their strength could soon run out as overbought conditions kick in. This implied that the ongoing trend reversal favoring the downside could continue in the near term.
As such, a daily candlestick close below the immediate support level at $1.5, would invalidate the recovery efforts and extend the current sell-off, resulting in another correction toward the 12-hourly SMA at $1.30.
In highly bearish cases, the BLUR price could revisit the 26 SMA at $1.02 and the 50 SMA at $1, before tagging the chart pattern’s bottom at $0.86. Such a move would completely invalidate the bullish thesis.
Read More:
- Blur NFT Airdrop & $BLUR Price Prediction – Best Crypto to Buy Now?
- Get Your Sweat On and Earn Crypto with Fight Out – The Ultimate Move-to-Earn Platform of 2023
- How to Buy Bitcoin
Best Wallet - Diversify Your Crypto Portfolio

- Easy to Use, Feature-Driven Crypto Wallet
- Get Early Access to Upcoming Token ICOs
- Multi-Chain, Multi-Wallet, Non-Custodial
- Now On App Store, Google Play
- Stake To Earn Native Token $BEST
- 250,000+ Monthly Active Users
Join Our Telegram channel to stay up to date on breaking news coverage