Join Our Telegram channel to stay up to date on breaking news coverage
Key Points Bitcoin price formed a short-term top near $8,600 and started a downside move against the US Dollar. There was a break below a key bullish trend line with support at $8,370 on the hourly chart of the BTC/USD pair (data feed from Kraken). The pair must hold the $8,240 support and the 100 hourly simple moving average to avoid more losses.
Bitcoin price is trading above a major support at $8,240 against the US Dollar. BTC/USD should stay above the 100 hourly SMA to trim recent losses.
Bitcoin Price Analysis
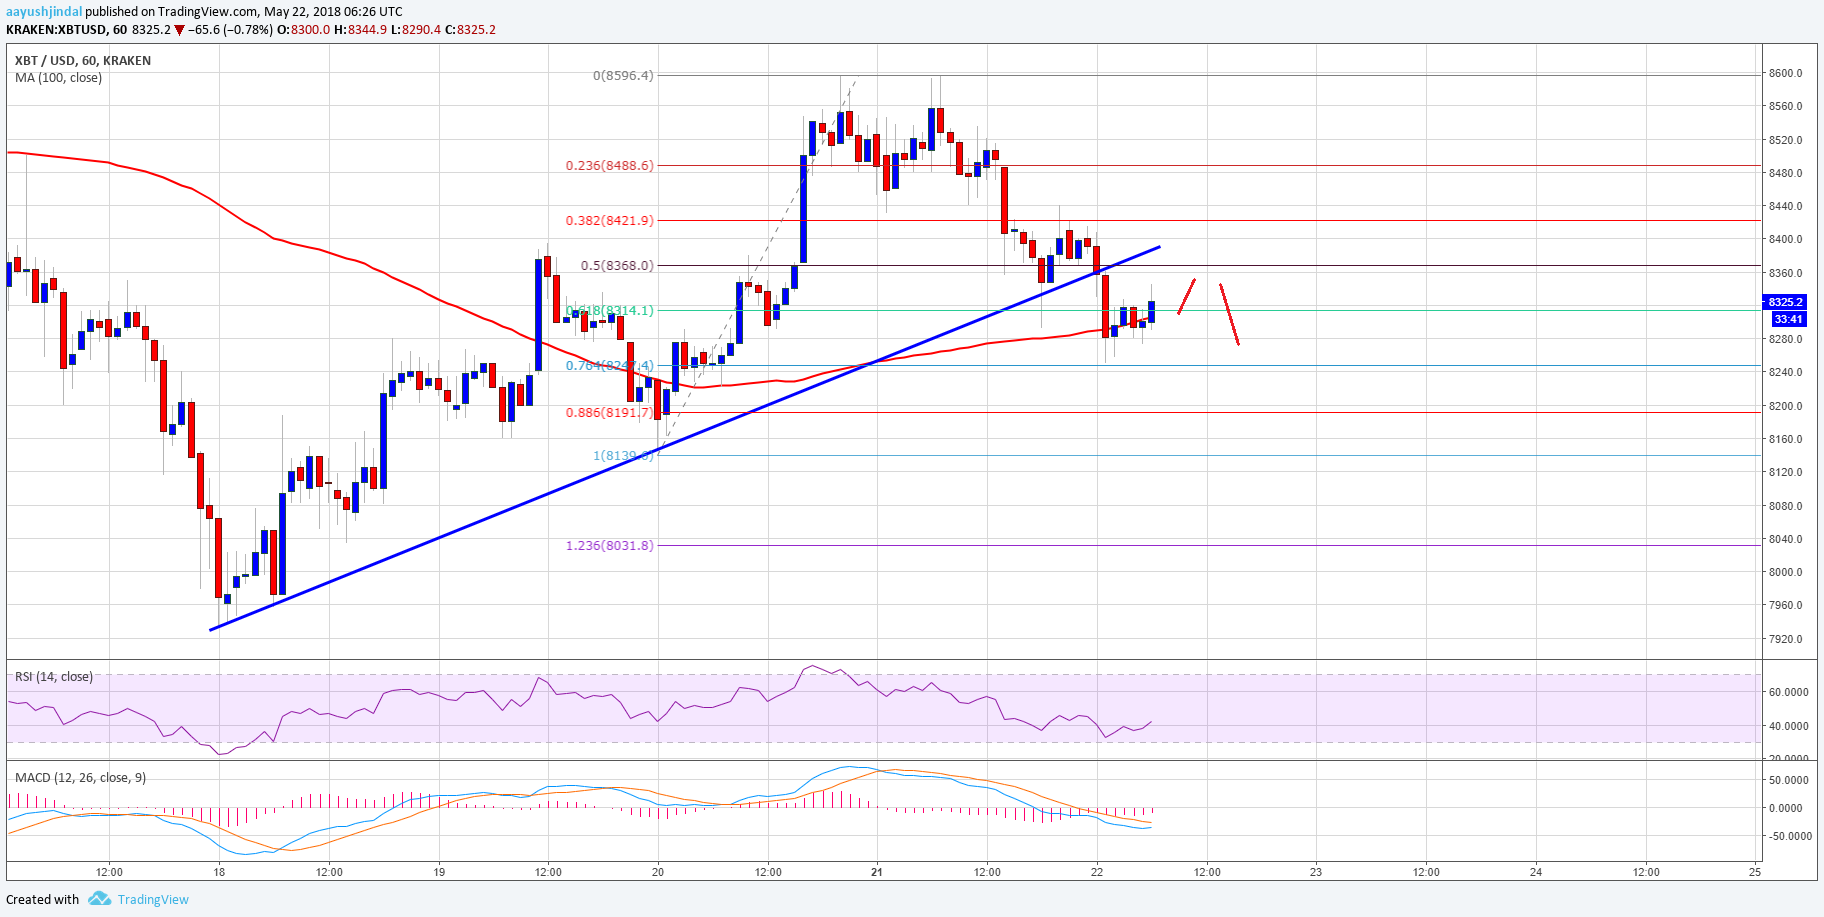
After trading towards the $8,600 level, bitcoin price faced a selling interest against the US Dollar. The BTC/USD pair formed a short-term top at $8,596 and started a downside move. The price declined and moved below the $8,400 support level. More importantly, there was a break below the 50% Fib retracement level of the last wave from the $8,139 low to $8,596 high.
It opened the doors for more losses, resulting in a break below a key bullish trend line with support at $8,350 on the hourly chart of the BTC/USD pair. The pair almost tested the 76.4% Fib retracement level of the last wave from the $8,139 low to $8,596 high. However, the price is currently holding the 100 hourly simple moving average and $8,280. On the upside, an immediate resistance is at $8,400, followed by the all-important $8,600. As long as the price is above the 100 hourly SMA, it could make an attempt to surpass the $8,400 level. On the other hand, a close below the 100 hourly SMA may perhaps push the price back towards $8,150.
Looking at the chart, the price is showing a few positive signs above $8,240. However, BTC buyers must clear the $8,400 hurdle for a push towards $8,600.
Looking at the technical indicators:
Hourly MACD – The MACD for BTC/USD is slowly moving in the bearish zone.
Hourly RSI (Relative Strength Index) – The RSI is moving higher towards the 50 level.
Major Support Level – $8,240
Major Resistance Level – $8,400
The post Bitcoin Price Watch: Can BTC/USD Hold 100 SMA? appeared first on NewsBTC.
Join Our Telegram channel to stay up to date on breaking news coverage