Join Our Telegram channel to stay up to date on breaking news coverage
Key Points
- Bitcoin price surged higher recently and broke the $6,350 and $6,375 resistances against the US Dollar.
- There was a break above a major contracting triangle with resistance at $6,350 on the hourly chart of the BTC/USD pair (data feed from Kraken).
- The price traded towards the $6,475 level and it is currently correcting lower.
Bitcoin price moved into a bullish zone above $6,375 against the US Dollar. BTC/USD is correcting lower, but it is likely to find support near $6,380 or $6,375.
Bitcoin Price Analysis
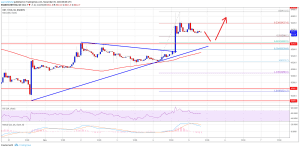
After testing the $6,200 support area, bitcoin price found a strong buying interest against the US Dollar. The BTC/USD pair started an upward move and traded above the $6,335 and $6,350 resistance levels. The upside move was strong as the price even settled above $6,375 and 100 hourly simple moving average. Buyers pushed the price above the $6,410-20 resistance zone and a new weekly high was formed at $6,472.
During the upward move, there was a break above a major contracting triangle with resistance at $6,350 on the hourly chart of the BTC/USD pair. Later, the price started a downside correction and declined below $6,440. There was a break below the 23.6% Fib retracement level of the recent wave from the $6,323 low to $6,472 high. However, there are many supports on the downside near the $6,380 level. An immediate support is at $6,398-6,400. Below this, the next support is at $6,375 and the 61.8% Fib retracement level of the recent wave from the $6,323 low to $6,472 high.
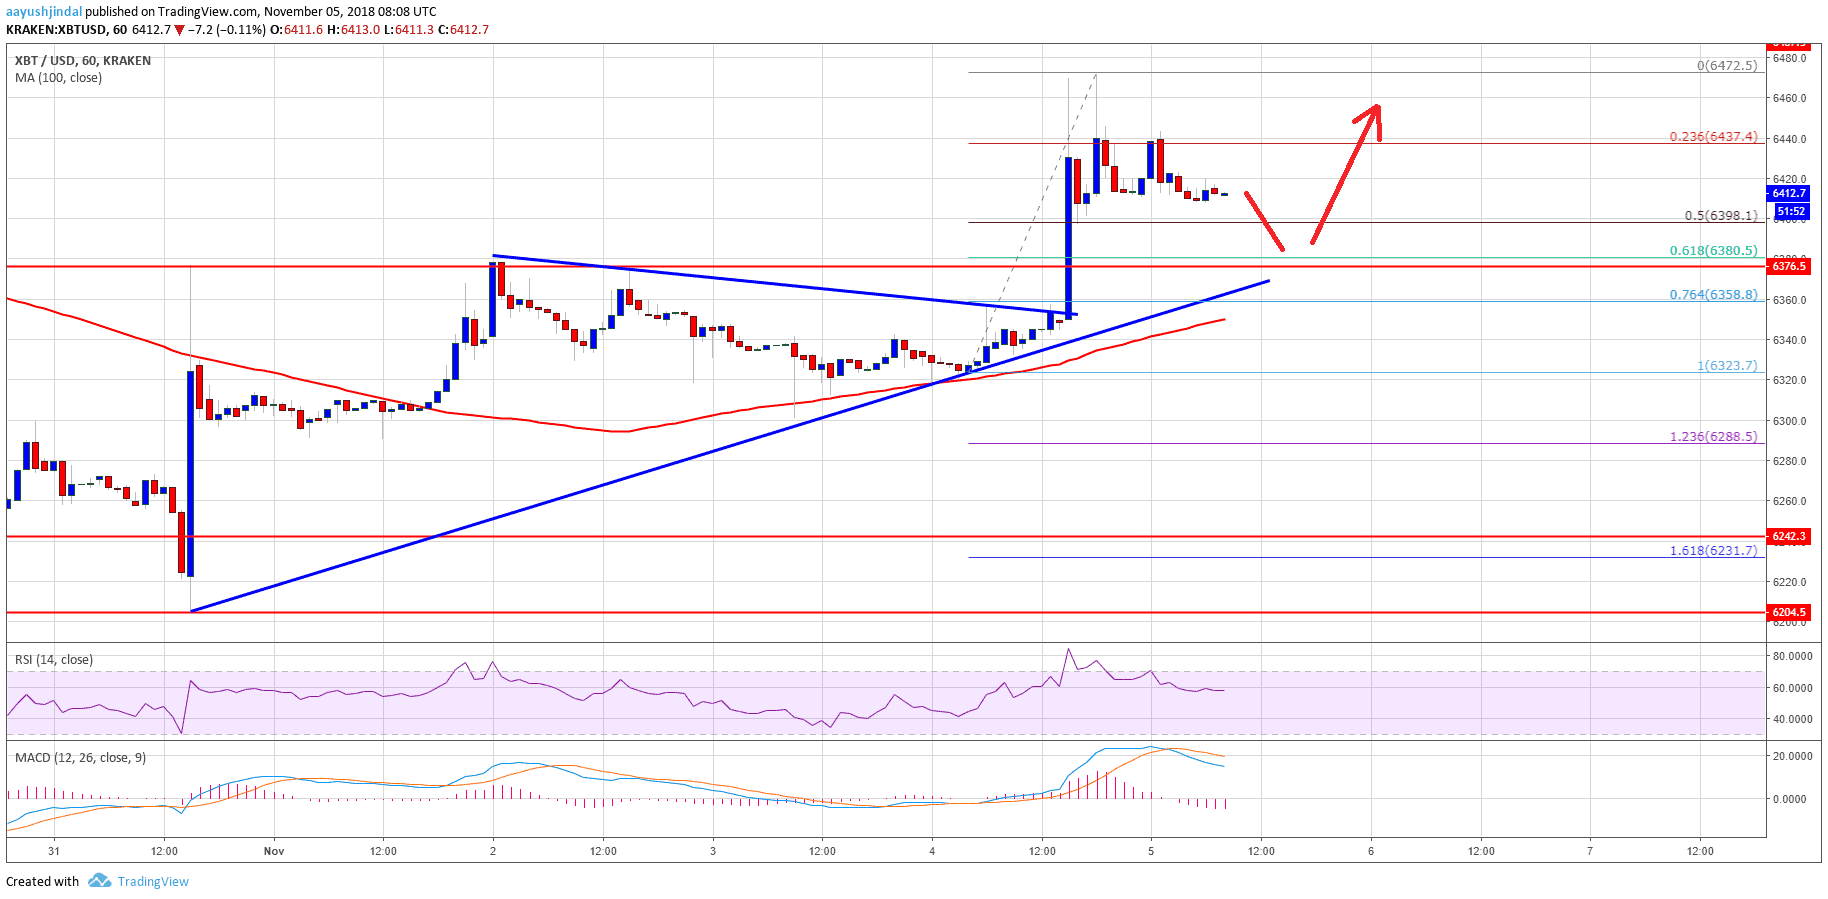
Looking at the chart, bitcoin price is clearly trading in a positive zone above $6,375 and 100 hourly simple moving average. As long as there is no close below the 100 hourly SMA, the price is likely to accelerate above $6,440 or $6,475 in the near term.
Looking at the technical indicators:
Hourly MACD – The MACD for BTC/USD is slowly moving in the bearish zone.
Hourly RSI (Relative Strength Index) – The RSI is still well above the 50 level.
Major Support Level – $6,375
Major Resistance Level – $6,475
The post Bitcoin Price Watch: BTC/USD Turned Bullish Above $6,400 appeared first on NewsBTC.
Join Our Telegram channel to stay up to date on breaking news coverage