Join Our Telegram channel to stay up to date on breaking news coverage
Bitcoin (BTC) Price Prediction – July 16
Today, BTC/USD bears are trying to push their agenda and threatening $9,000.
BTC/USD Long-term Trend: Bearish (Daily Chart)
Key levels:
Resistance Levels: $9,500, $9,700, $9,900
Support Levels: $8,700, $8,500, $8,300

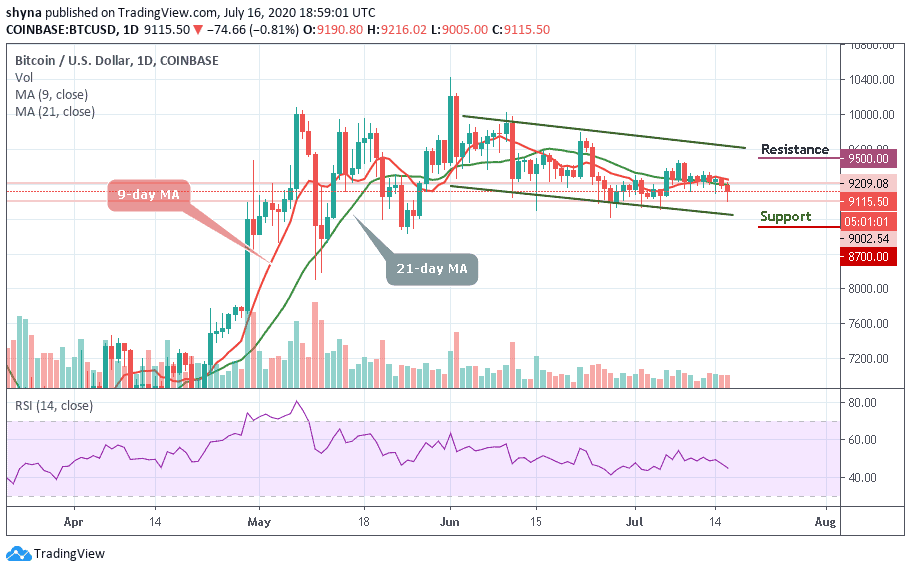
BTC/USD has been drifting lower since the start of the day amid global sell-off on the cryptocurrency market. Currently, the king coin is now moving within a short-term bearish trend because the volatility is high. BTC/USD may be vulnerable to further losses as the RSI (14) on the intraday chart points downward.
However, from the longer-term point of view, BTC/USD is still in the range as long as the lower boundary of the recent consolidation channel $9,000 remains unbroken. Bitcoin is now way below the 9-day and 21-day moving averages but the bulls still have time to close above it in the next few hours. Meanwhile, the $9,000 level remains as the most crucial support point.
Now, Bitcoin (BTC) is looking fragile and weak as a more bearish move is likely if the $9,100 support can no longer contain selling pressure. If this happens, the $9800, $9500, and $9300 support may be tested within a blink. However, an evident surge above the moving averages could bring BTC back in an upward range, meeting $9,500, $9,700, and $9,900 resistance levels where the channel’s upper boundary lies.
BTC/USD Medium-Term Trend: Bearish (4H Chart)
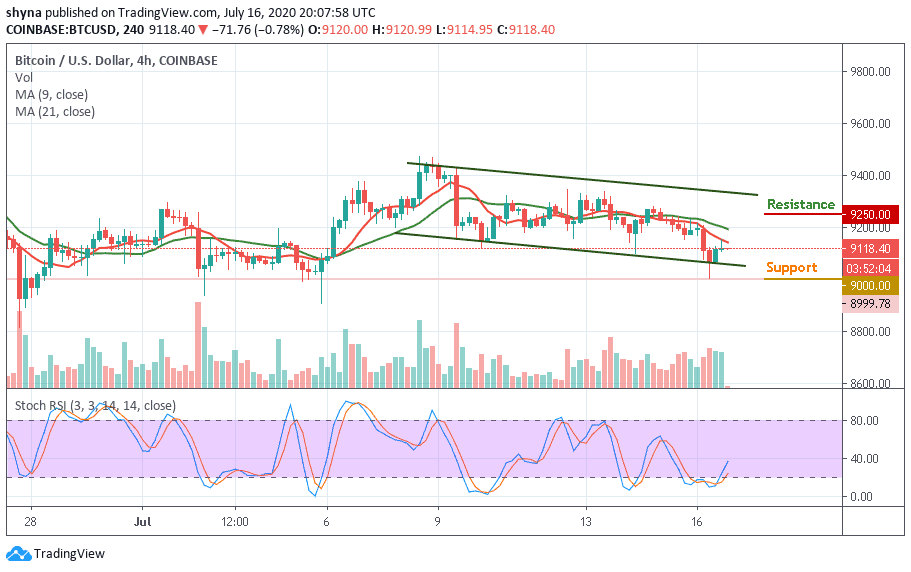
The 4-hour chart reveals that the market is following a negative sign as the price moves below the 9-day and 21-day moving averages. However, the intraday trading is looking bearish; following the recent rebound at $9,057 which is the key support level but now trading at $9,118. The next key support levels lie at $9,000, $8,800, and $8,600.

However, considering the recent sharp rebound, the Bitcoin price may re-enter the bullish rally to $9,200 resistance. A climb above the mentioned resistance may further push BTC price to $9,250, $10,150, and $10,350 resistance levels. As it is now, it seems the market may likely follow the new bullish movement as the stochastic RSI focuses and moves from the oversold zone which could continue the upward direction.
Join Our Telegram channel to stay up to date on breaking news coverage

