Join Our Telegram channel to stay up to date on breaking news coverage
The Bitcoin (BTC) price prediction loses traction as the king coin may revisit the south; losses are likely to continue should it break additional supports.
Bitcoin Prediction Statistics Data:
- Bitcoin price now – $19,553
- Bitcoin market cap – $374.1 billion
- Bitcoin circulating supply – 19.1 million
- Bitcoin total supply – 19.1 million
- Bitcoin Coinmarketcap ranking – #1
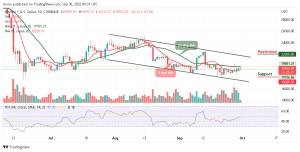
BTC/USD Long-term Trend: Ranging (Daily Chart)
Key levels:
Resistance Levels: $22,000, $24,000, $26,000
Support Levels: $18,000, $16,000, $14,000
Your capital is at risk
According to the daily chart, BTC/USD is getting back to the red zone, posting major losses of 0.21% on the day after commencing the trading at $19,595. However, the market movement has an intraday high of $19,699; although the first digital asset touches the support level of $19,312 before going back to where it is currently trading at $19,553.
Bitcoin Price Prediction: Bitcoin (BTC) Ready to Plunge More
The Bitcoin price is trading within the 9-day and 21-day moving averages, after touching $19,312 as the current daily low in the market. This could mean that Bitcoin (BTC) is likely to search for a new low. However, as the daily volume candle supports the sellers, together with the 9-day moving average staying below the 21-day moving average, it can be assumed that a stronger bearish movement could surface if the king coin follows the negative side.
However, BTC/USD is struggling to maintain the $19,600 resistance level, if the coin begins the downward trend, the technical indicator Relative Strength Index (14) is likely to remain below the 50-level, and the next support levels may come at $18,000, $16,000, and $14,000. On the contrary, if the coin crosses above the 21-day moving average, the further bullish movement could face the upper boundary of the channel, and this may cause the king coin to hit the resistance levels of $22,000, $24,000, and $26,000.
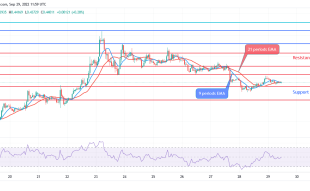
BTC/USD Medium-term Trend: Ranging (4H Chart)
On the 4-Hour chart, the Bitcoin price is hovering above the 9-day and 21-day moving averages, should the bulls gather enough strength and remain above the moving averages; the upward movement may be able to near the resistance level of $20,500 and above.
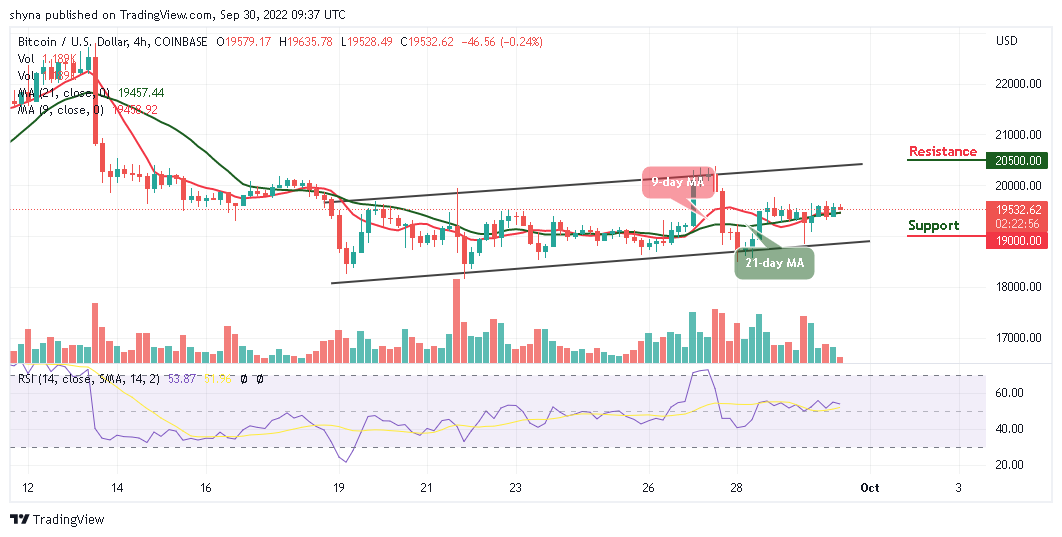
However, on the downside, immediate support could be located below the moving averages to hit the main support at the $19,500 level. The price may likely fall furthermore and move towards the critical support level at $19,000 and below, if the sellers put more pressure on the market, any further movement could push the coin towards the lower boundary of the channel, and the Relative Strength Index (14) may continue to move sideways.
Join Our Telegram channel to stay up to date on breaking news coverage