Join Our Telegram channel to stay up to date on breaking news coverage
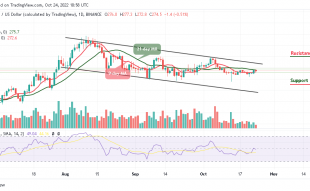
The Bitcoin price prediction retested the $19,240 support level as it is now rising, but it must clear $19,800 and the moving averages for a steady increase.
Bitcoin Prediction Statistics Data:
- Bitcoin price now – $19,644
- Bitcoin market cap – $376.7 billion
- Bitcoin circulating supply – 19.1 million
- Bitcoin total supply – 19.1 million
- Bitcoin Coinmarketcap ranking – #1
BTC/USD Long-term Trend: Ranging (Daily Chart)
Key levels:
Resistance Levels: $22,000, $23,000, $24,000
Support Levels: $17,000, $16,000, $15,000
BTC/USD is currently recovering higher from the $19,240 support zone and the first digital asset must trade above the 9-day and 21-day moving averages to start a fresh increase in the near term. Looking at the daily chart, traders could see that the Bitcoin price is yet to break above the upper boundary of the channel.
Bitcoin Price Prediction: Would BTC Climb Higher this time?
As revealed by the daily chart, the Bitcoin price faces the upside, touching the daily high at $19,650. In the meantime, traders could see that the Bitcoin price has continued to converge above the key level of $19,600. The 9-day MA trend line is also ready to cross above the green trend line of the 21-day MA as they both prepare to face the north. The Relative Strength Index (14) moves above the 50-level in an attempt to probably cross back to the north. However, this signals that the return of a bullish uptrend may likely play out.
Nevertheless, a clear break above the upper boundary of the channel could set the pace for a larger increase to $22,000, $23,000, and $24,000 resistance levels. On the contrary, should Bitcoin price fail to clear the $20,000 resistance, it could start a new decline as the initial support on the downside is near the $19,240 level. If there is a downside break towards the lower boundary of the channel, the price could hit the support levels at $17,000, $16,000, and $15,000.
BTC/USD Medium-term Trend: Ranging (4H Chart)
The 4-hour chart for BTC is looking bullish as the market spikes to cross above the upper boundary of the channel. At the moment, the intraday trading is still looking bullish; following the recent rebound at $19,262 which is now a key support level while the next key support level is around $19,000 and below.
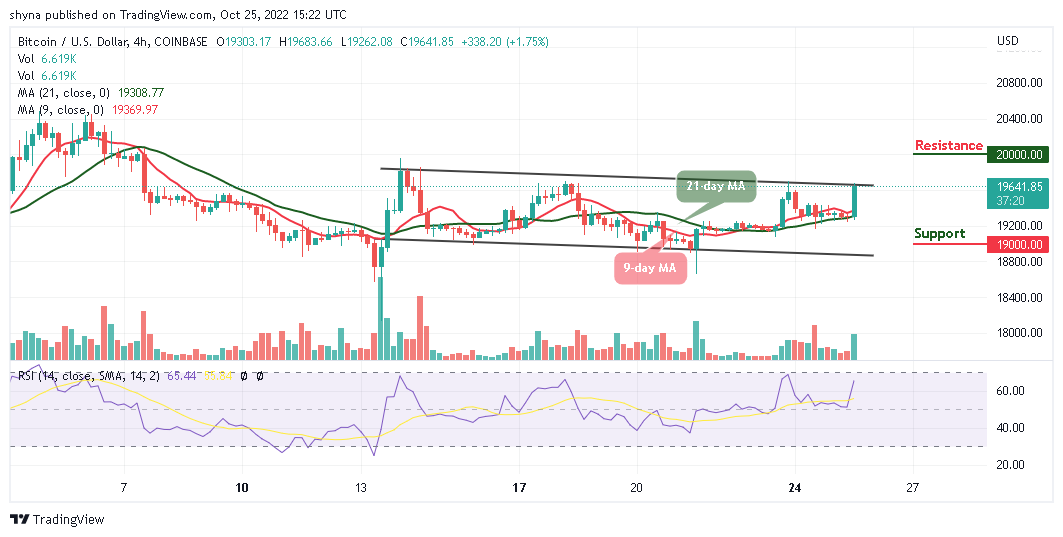
However, considering the recent sharp rebound, the Bitcoin price may continue the bullish rally to the $19,800 resistance. A climb above the mentioned resistance may further push the BTC price to the resistance levels of $20,000 and above. As it appeared now, it seems bulls have returned to the market as the Relative Strength Index (14) is likely to cross into the overbought region, suggesting more bullish signals.
The first phase of the IMPT presale is currently underway, with each token trading at $0.018. However, the Impact tokens will be sold at $0.023 each in the second stage. And the price of the asset is expected to increase further in the third stage.
The Dash 2 Trade presale got off to a great start, having now raised over $2 million in just a few days. In the first stage, the price was only $0.0476, and now it has gone to $0.05. In the third stage of the presale, the price will rise again to $0.0513.
Related:
- How to Buy IMPT Token
- How to Buy D2T
Join Our Telegram channel to stay up to date on breaking news coverage