Join Our Telegram channel to stay up to date on breaking news coverage
The Bitcoin price prediction is slightly under $19,500 amid the struggle to extend the bullish leg above the $20,000 resistance.
Bitcoin Prediction Statistics Data:
- Bitcoin price now – $19,331
- Bitcoin market cap – $372.7 billion
- Bitcoin circulating supply – 19.1 million
- Bitcoin total supply – 19.1 million
- Bitcoin Coinmarketcap ranking – #1
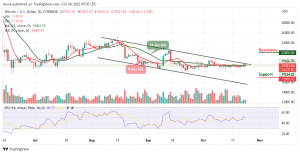
BTC/USD Long-term Trend: Ranging (Daily Chart)
Key levels:
Resistance Levels: $22,000, $23,000, $24,000
Support Levels: $17,000, $16,000, $15,000
BTC/USD is trading around the 9-day and 21-day moving averages, as the market price remains above $19,000. During the European session today, the Bitcoin price trades near the $20,000 resistance. Initially, trading above $20,000 has been an uphill battle for the coin, while most of the price actions toward the upside stalled around this level.
Bitcoin Price Prediction: Bitcoin (BTC) Could Remain Flat
The break above $20,000 is going to be a big step for the Bitcoin price as this will allow them to expand their scope above $21,000, which has always been a restriction for the coin. Note that Bitcoin (BTC) is seen above the 9-day and 21-day moving averages, but it could still bring massively bullish signals for the market if the bulls play out. However, if the price should slump below the moving averages, the $18,000 level could be an important zone to keep an eye on. Once bulls flip this level into support, the following major supports for the world’s leading crypto could be $17,000, $16,000, and $15,000.
However, the king coin continues to hover around the $19,331 zone; there are two crucial price levels to pay attention to; the underlying support at $19,000 and the overhead resistance at $20,000, which will help determine where prices are likely to head next as the potential resistance levels could be located at $22,000, $23,000, and $24,000. Meanwhile, the technical indicator Relative Strength Index (14) suggests a bearish movement as the signal line moves below the 50-level.
BTC/USD Medium-term Trend: Ranging (4H Chart)
According to the 4-hour chart, BTC/USD needs to remain above the 9-day and 21-day moving averages to mitigate the short-term bullish pressure and allow for an extended recovery toward $19,500. However, a higher resistance level may be found at $20,200 and above.
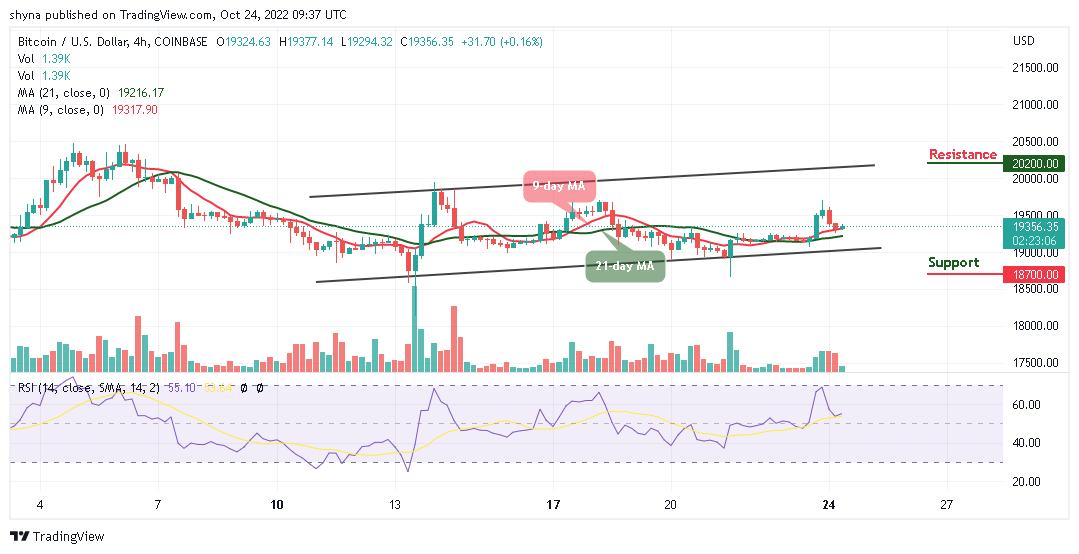
On the other hand, the nearest support is below the moving average at $19,000, while a critical move below this level may increase the downside pressure to the support level of $18,700 and below. Meanwhile, the technical indicator Relative Strength Index (14) could be starting a bullish movement above the 50-level, which could push the coin to the positive side.
At the time of writing, the IMPT token is already on presale, and in less than a few weeks, the token managed to raise more than $7 million. However, with over 25,000 affiliates joining their network and using their services, IMPT has a solid foundation to make a significant leap once their presale ends.
Stage one of the Dash 2 Trade presale has been sold out and this took less than 4 days. At the moment, D2T is still cheap at 0.05 USDT in stage two, the amount raised so far approaches $2 million.
Related:
- How to Buy IMPT Token
- How to Buy D2T
Join Our Telegram channel to stay up to date on breaking news coverage