Join Our Telegram channel to stay up to date on breaking news coverage
The Bitcoin price prediction shows that BTC is likely to follow the bearish movement as the price remains below the moving averages.
Bitcoin Prediction Statistics Data:
- Bitcoin price now – $19,173
- Bitcoin market cap – $367.7 billion
- Bitcoin circulating supply – 19.1 million
- Bitcoin total supply – 19.1 million
- Bitcoin Coinmarketcap ranking – #1
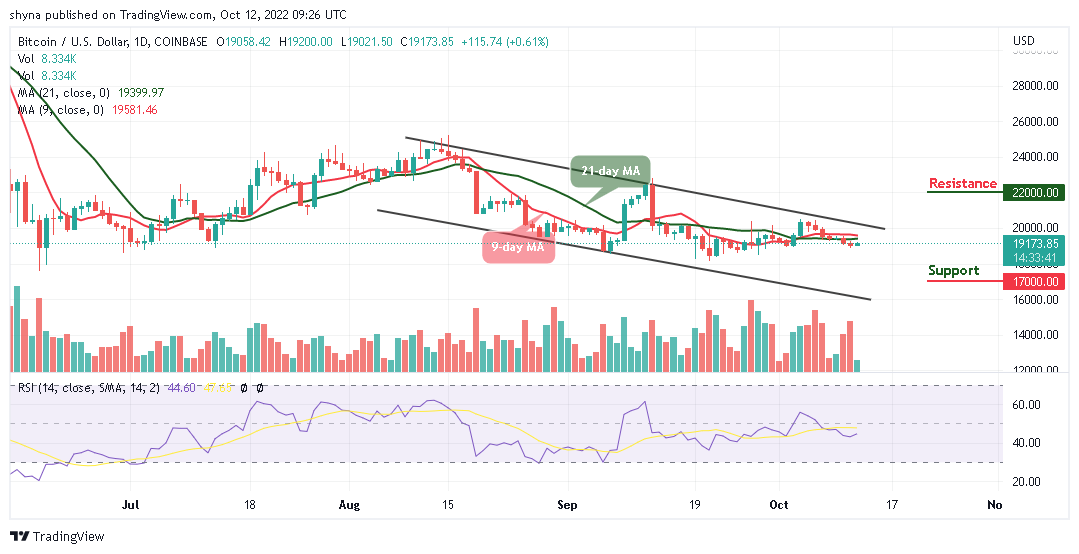
BTC/USD Long-term Trend: Bearish (Daily Chart)
Key levels:
Resistance Levels: $22,000, $24,000, $26,000
Support Levels: $17,000, $15,000, $13,000
Your capital is at risk
According to the daily chart, BTC/USD is could experience an unexpected selloff as far as the market price remains below the 9-day and 21-day moving averages. The first digital asset touches the support of $19,021 today. A reversal is been played out, and it could send the king coin above the resistance level of $20,000 if the buyers increase the buying pressure within the market.
Bitcoin Price Prediction: Bitcoin (BTC) May Gain More Downsides
At the time of writing, the technical indicator Relative Strength Index (14) remains below the 50-level. This could mean that there is still room that may be explored by the bears if head to the south. Therefore, the Bitcoin price may follow the downtrend if the market price crosses below the support level of $19,000.
On the upside, recovery may be delayed but any attempt to move toward the upper boundary of the channel could negate the bearish movement and allow the Bitcoin price to move toward the resistance levels of $22,000, $24,000, and $26,000. Therefore, an increase in selling pressure may force the Bitcoin price to follow a bearish path toward the support levels of $17,000, $15,000, and $13,000.
BTC/USD Medium-term Trend: Ranging (4H Chart)
On the 4-hour chart, the Bitcoin price may cross above the 9-day and 21-day moving averages as the coin keeps recovering from the lower boundary of the channel. However, the Bitcoin price could return to the bull market if the 9-day MA crosses above the 21-day MA. Higher resistance could be located at $20,000 and above.
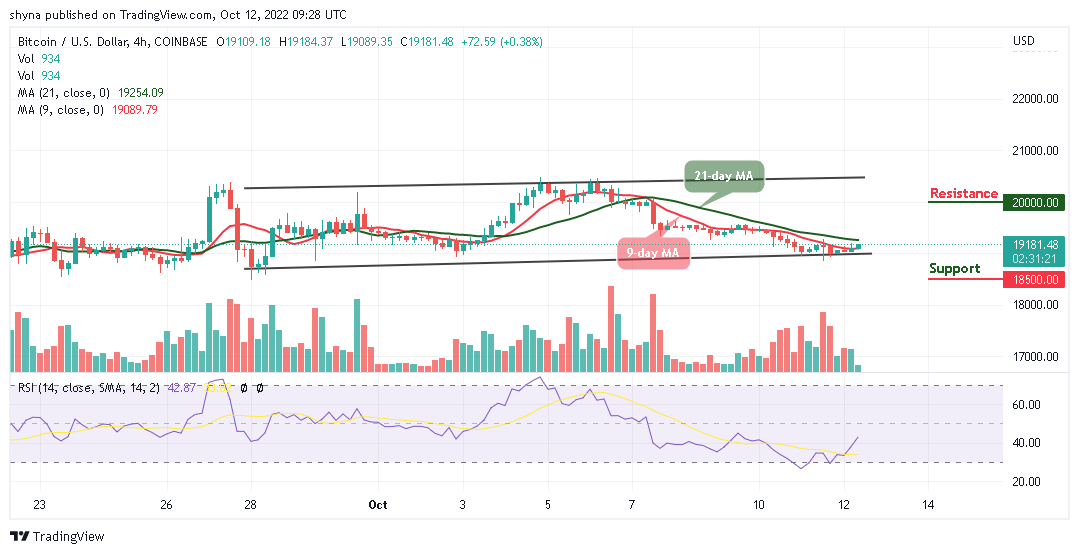
Moreover, if the price drops below the channel, the support level of $18,800 may not be able to hold the coin. Therefore, the king coin is likely to touch the support level of $18,500 and below if the price breaks below the lower boundary of the channel. Meanwhile, the Relative Strength Index (14) is crossing above the 40-level to confirm the possible bullish movement.
Join Our Telegram channel to stay up to date on breaking news coverage