
Join Our Telegram channel to stay up to date on breaking news coverage
The Bitcoin price prediction shows that BTC is still in a tight range as the market sentiment could decline from optimistic to bearish.
Bitcoin Prediction Statistics Data:
- Bitcoin price now – $27,345
- Bitcoin market cap – $529.4 billion
- Bitcoin circulating supply – 19.3 million
- Bitcoin total supply – 19.3 million
- Bitcoin Coinmarketcap ranking – #1
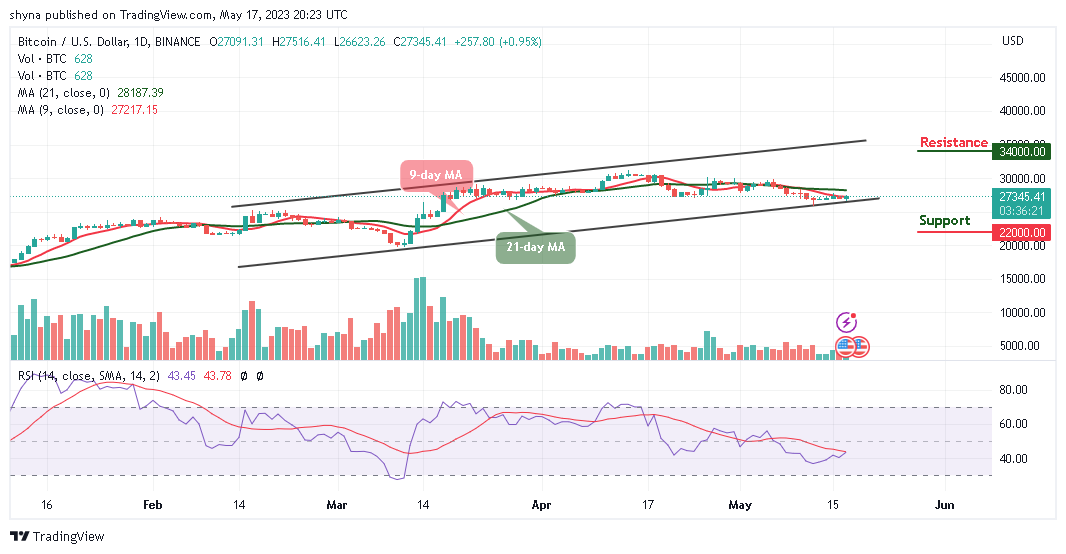
BTC/USD Long-term Trend: Ranging (Daily Chart)
Key levels:
Resistance Levels: $34,000, $36,000 $38,000
Support Levels: $22,000, $20,000, $18,000
BTC/USD is likely to face a bullish movement if the king coin crosses above the 9-day and 21-day moving averages. On the contrary, the Bitcoin price is likely to have a bearish run in the short term if the sellers return to the market. Currently, Bitcoin (BTC) is trading around the $27,345 level after touching the daily high of $27,516 today.
Bitcoin Price Prediction: Bitcoin (BTC) May Head to the Upside
Looking at the daily chart, the Bitcoin price is moving sideways as the buyers brace for a possible impact within the market. Meanwhile, if the Bitcoin price slumps below the support level of $26,000, the king coin is likely to gain more downtrends; any further bearish movement could locate the supports at $22,000, $20,000, and $18,000.
Nevertheless, the technical indicator Relative Strength Index (14) is moving above the 40-level while the trading volume could be coming up gradually. However, if the bulls decide to push the price above the 21-day moving average, BTC/USD may head toward the upper boundary of the channel to locate the resistance levels at $34,000, $36,000, and $38,000 respectively.
BTC/USD Medium-term Trend: Bearish (4H Chart)
On the 4-Hour chart, the Bitcoin price keeps moving above the 9-day and 21-day moving averages, and the immediate support lies at the $26,500 level. However, the price may head toward the lower boundary of the channel if the bears stepped back into the market.
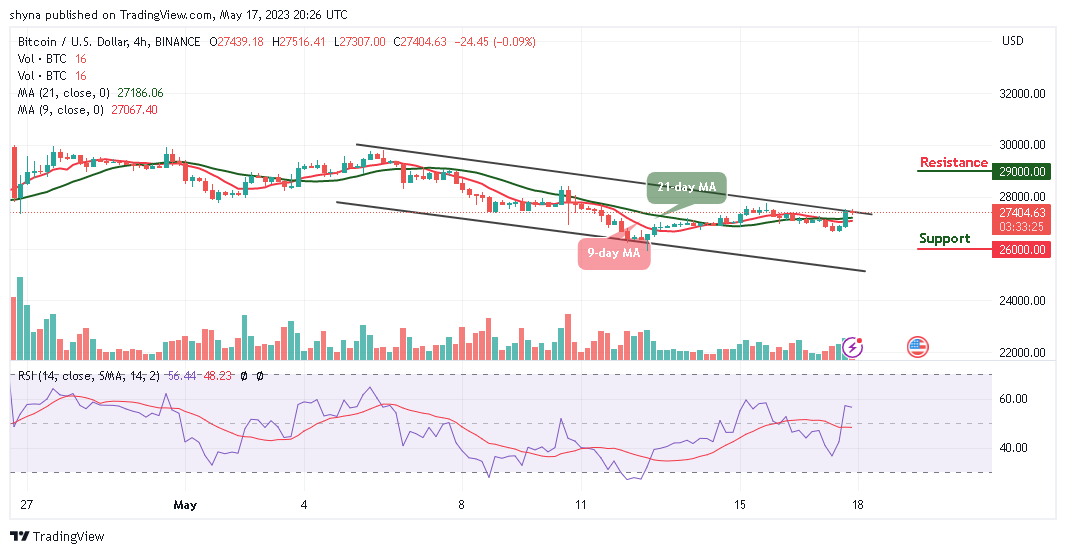
Nonetheless, any further bearish movement could test the critical support at the $26,000 level and below, while the resistance could be located above the channel at the resistance level of $29,000 and above. Meanwhile, the Bitcoin price is likely to move sideways as the technical indicator Relative Strength Index (14) remains below the 60-level.
Alternatives to Bitcoin
The Bitcoin price has seen some turbulent times struggling to surpass $27,000 for the past few days. Technicals are now bullish, with green candles moving to cross above the u9-day moving average. The Relative Strength Index (14) indicator showcases an ongoing rally and also creates a bullish scenario as the signal line moves above the 40-level. Meanwhile, the AiDoge platform uses sophisticated AI algorithms to generate quality memes which are trained on meme datasets and crypto news. Its platform uses sophisticated AI algorithms to generate quality memes which are trained on meme datasets and crypto news; the token has raised almost $10 million in the ongoing presale.
Read more:
Join Our Telegram channel to stay up to date on breaking news coverage