Join Our Telegram channel to stay up to date on breaking news coverage
The Bitcoin price prediction indicates sideways movement as the coin fails to head toward the upper boundary of the channel.
Bitcoin Prediction Statistics Data:
- Bitcoin price now – $28,079
- Bitcoin market cap – $540.3 billion
- Bitcoin circulating supply – 19.3 million
- Bitcoin total supply – 19.3 million
- Bitcoin coinmarketcap ranking – #1
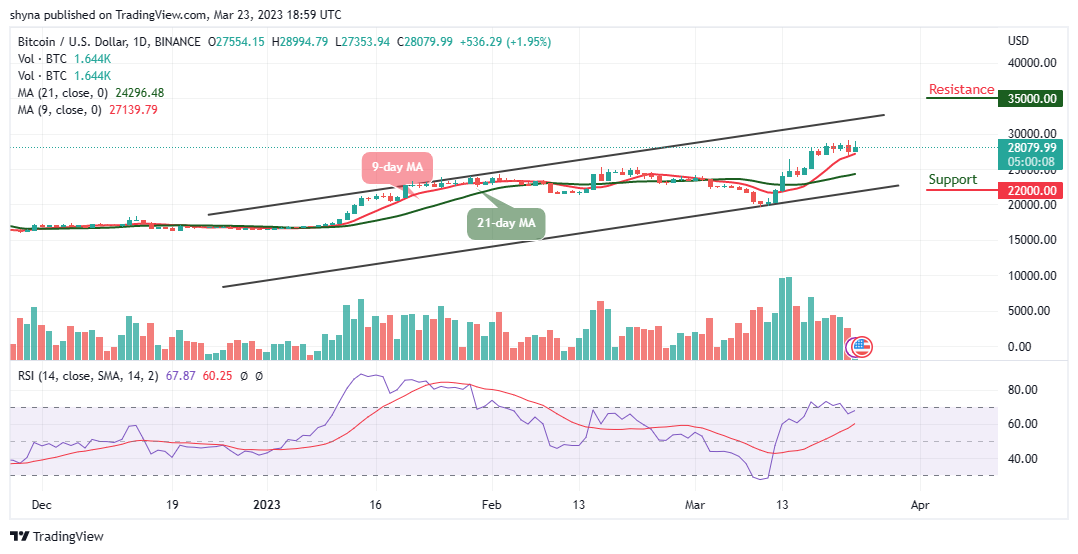
BTC/USD Long-term Trend: Bullish (Daily Chart)
Key levels:
Resistance Levels: $35,000, $36,000, $37,000
Support Levels: $22,000, $23,000, $24,000
BTC/USD is hovering at $28,079 but the king coin has not been able to reclaim the resistance level of $29,000 as the coin consolidates above the 9-day and 21-day moving averages. At the moment, the Bitcoin price may begin to follow the sideways movement, but the daily chart shows that the formation of a bullish movement is likely to play out.
Bitcoin Price Prediction: BTC Price May Consolidates to the Upside
As the Bitcoin price moves toward the east, it is likely to rise and face the upper boundary of the channel as the technical indicator Relative Strength Index (14) could make a bullish cross above the 50-level and this could mean that the king coin is ready for the upside. Looking at it from above, recovery may set in bit by bit as the bulls may push the king coin above the resistance level of $29,000.
However, a sustainable movement towards the north may reach the resistance level of $29,000, which could allow for an extended recovery in the direction of the potential resistance levels at $35,000, $36,000, and $37,000. On the downside, any bearish movement may cause the Bitcoin price to hit the supports at $22,000, $21,000, and $20,000.
BTC/USD Medium-term Trend: Bullish (4H Chart)
Looking at the 4-hour chart, the Bitcoin price is likely to slide below the 9-day and 21-day moving averages. On the contrary, BTC/USD may head toward the upper boundary of the channel if the market recovers from the bearish momentum. However, if the price is stable above the moving averages and crosses above the upper boundary of the channel, it could locate the resistance level of $32,000 and above.
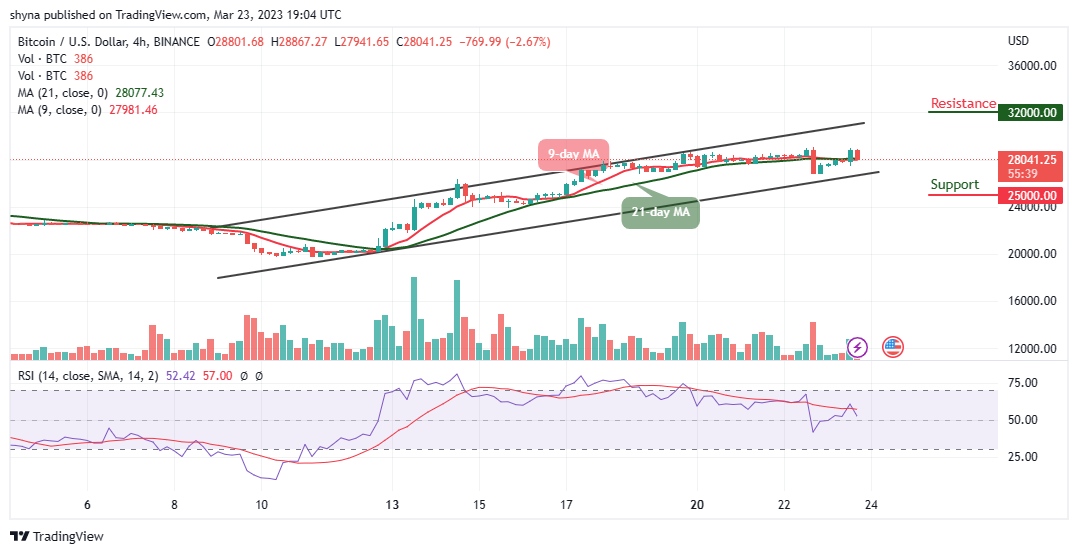
Moreover, if the bearish movement continues in the market, the support level of $27,000 may not be able to hold the selling pressure. Therefore, BTC/USD is likely to fall to $25,000 and below if the market price crosses the lower boundary of the channel. Nevertheless, the technical indicator Relative Strength Index (14) is moving to cross below the 50-level, suggesting bearish signals in the market.
Alternatives to Bitcoin
The Bitcoin price movement on the daily chart is struggling in touching the $29k, the king coin is seen pulling back to where it is currently trading and could head downwards if the bears step back into the market. Meanwhile, the LHINU token powers the whole Love Hate Inu ecosystem. It is an ERC 20 token that can be staked for rewards when you vote on polls. As a result, none of the tokens are for developers – or for the ecosystem as a whole. The total tokens in the presale are 100 billion, with 90% going toward the presale but almost $2m has been raised so far.
Join Our Telegram channel to stay up to date on breaking news coverage