Join Our Telegram channel to stay up to date on breaking news coverage
The Bitcoin price prediction reveals that BTC may break out of the current short-term pattern and revisit the resistance level of $29,000.
Bitcoin Prediction Statistics Data:
- Bitcoin price now – $27,889
- Bitcoin market cap – $534.4 billion
- Bitcoin circulating supply – 19.3 million
- Bitcoin total supply – 19.3 million
- Bitcoin Coinmarketcap ranking – #1
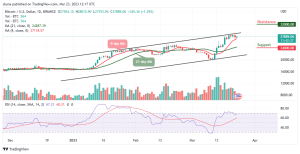
BTC/USD Long-term Trend: Bullish (Daily Chart)
Key levels:
Resistance Levels: $32,000, $34,000, $36,000
Support Levels: $24,000, $22,000, $20,000
BTC/USD is at the moment trading at $27,889 with a 1.25% gain since the beginning of today’s trading. The Bitcoin price could struggle to stay above the 9-day moving average. Moreover, for the Bitcoin price to remain above this barrier, it could make many traders feel that the $27,000 support level could be pretty strong.
Bitcoin Price Prediction: Would BTC Price Break Higher?
The Bitcoin price could not drop much cause of today’s trading, but if the first digital coin breaks below the support level of $27,000, it could change the direction of the coin to face the lower boundary of the channel. Alternatively, Bitcoin (BTC) may reclaim the previous resistance level of $29,000 to head to the upside. If successful, BTC/USD could aim at the resistance levels of $32,000, $34,000, and $36,000 respectively.
Nevertheless, the technical indicator Relative Strength Index (14) is moving to cross above the 60-level as the coin may consolidate around this level. Moreover, this could mean that there may still be a room that could be explored by the bears if it crosses below the 9-day moving average. Therefore, the support levels of $24,000, $22,000, and $20,000 may play out.
BTC/USD Medium-term Trend: Bullish (4H Chart)
From a technical point of view, on the 4-hour chart, the technical indicator Relative Strength Index (14) is now hovering above the 50-level, and this may confirm the sideways movement if it continues to move in the same direction. Meanwhile, adding to the above, there is a little bit of bullish divergence on the technical indicator as the king coin may cross above the 9-day moving average to continue the bullish movement.

However, if the Bitcoin price breaks below the lower boundary of the channel, the market price may reach support at $25,000 and below. Meanwhile, if the current market value rises and faces above the upper boundary of the channel, it may reach the resistance level at $31,000 and above.
Alternatives to Bitcoin
Looking at the daily chart, the Bitcoin price may confirm the bullish trend if the king coin moves above the upper boundary of the channel while it could resume bearish trend if the price crosses below the moving averages. However, Love Hate Inu (LHINU) members can earn rewards by voting on polls through the user interface. They can also make new polls by accessing the vote submission platform. Therefore, interested investors can be part and enjoy the benefits attached to the token as it has raised close to $2 million in the presale.
Join Our Telegram channel to stay up to date on breaking news coverage